
FIGURE 1.
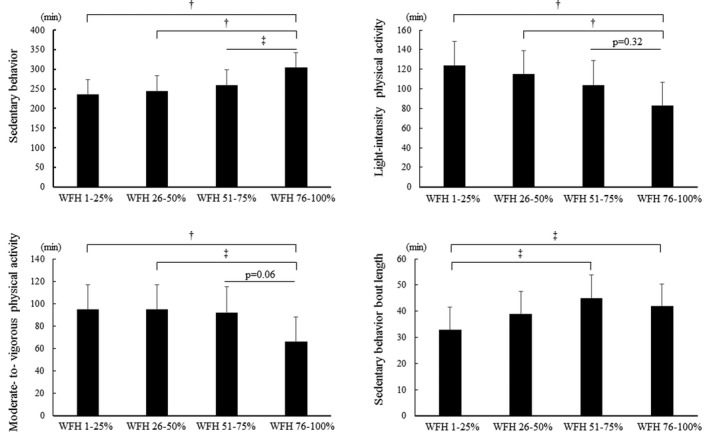
Comparisons of SB, intensity‐specific PA, and SB bout length during work among the different degree of WFH groups. SB, sedentary behavior; PA, physical activity; WFH, work from home. Values are presented as estimated means and standard error by analysis of covariance (ANCOVA), adjusted for age, gender, smoking, drinking frequency, body mass index (BMI), residential area, educational attainment, self‐rated health, job characteristics, industrial classification, and working time. Post hoc comparisons were examined using the Bonferroni method. †<.001, ‡<.05