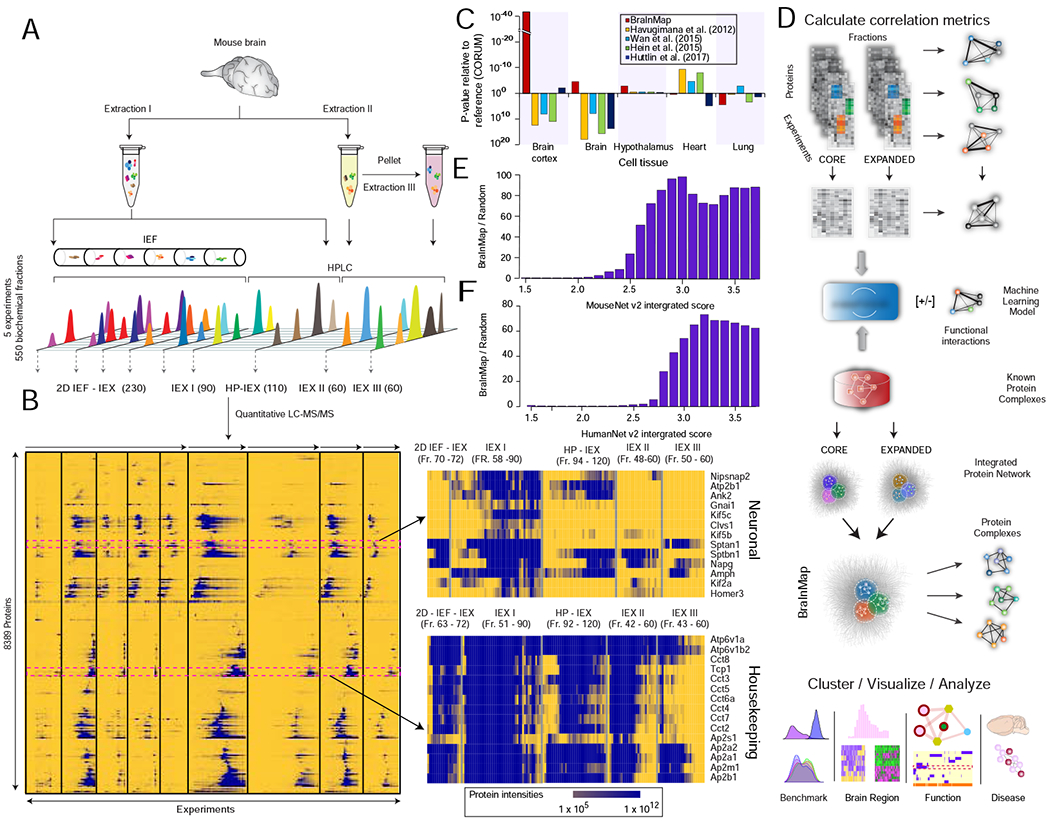
FIGURE 1 – Integrative workflow used to generate the mammalian Brain Interactome Map (BraInMap).

A Multi-pronged biochemical fractionation (high performance ion exchange chromatography, HPLC-IEX; isoelectric focusing, IEF; fraction numbers in brackets) of soluble macromolecular assemblies from mouse brain extracts.
B Hierarchical clustering of protein co-fractionation intensity profiles recorded by precision liquid chromatography-tandem mass spectrometry (LC-MS/MS); (right) neuronal (top) and housekeeping (bottom) components highlighted.
C Enrichment analysis (DAVID (Huang da et al., 2009)) of representative tissue annotations (UniProt) for proteins detected in this work relative to previously published interactome studies.
D Schematic depicting steps in the integrative BraInMap computational scoring pipeline: calculation of protein similarity (correlation) metrics, integrative classifier training (EPIC machine learning; (Hu et al., 2019)) and scoring of co-fractionation data (this study) and supporting (public) evidence to predict high-confidence co-complex interactions, followed by network partitioning, benchmarking and meta-analysis (pathobiological relevance) of the predicted complexes.
E Enrichment of interacting (co-eluting) brain proteins relative to random pairs for high functional similarity based on association scores reported in MouseNet (v2) (Kim et al., 2016)
F Enrichment of orthologs of interacting mouse brain proteins relative to random pairs for high functional association scores in HumanNet (v2) (Hwang et al., 2019).
