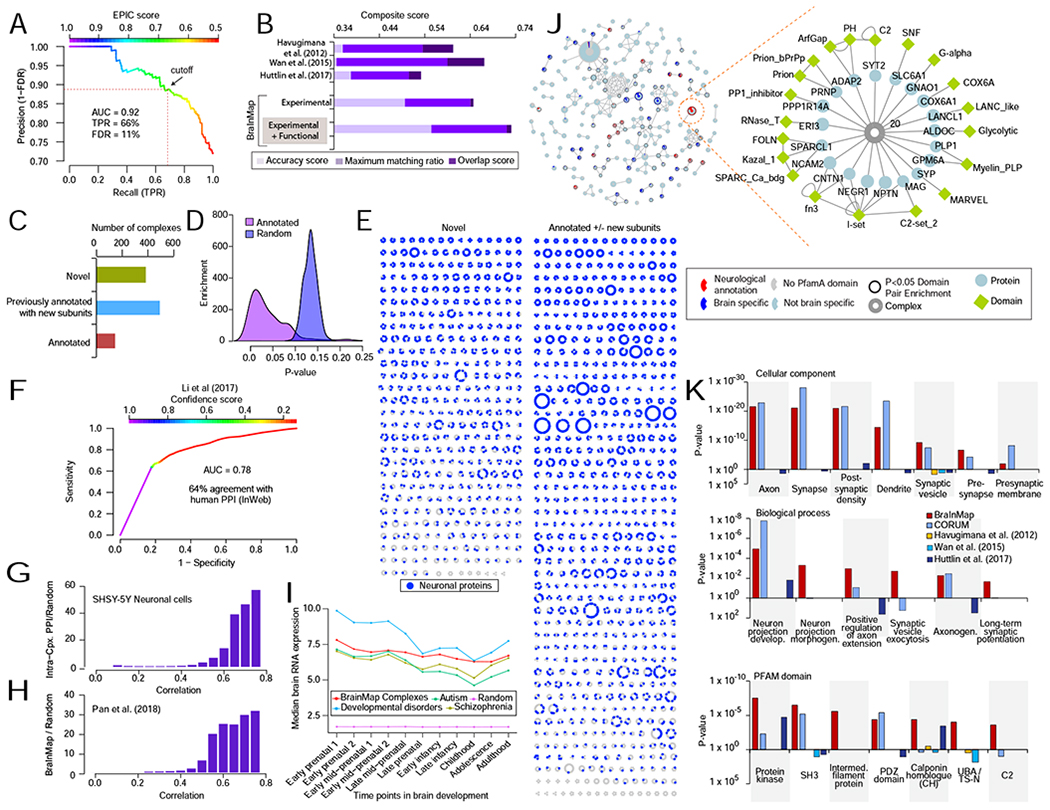
FIGURE 2 – Benchmarking reveals diverse, evolutionarily conserved brain complexes.

A Precision Recall (PR) analysis of predicted (EPIC score) co-complex interactions (CORE + EXPANDED) benchmarked against an independent (holdout) set of brain-derived reference assemblies establishes a false discovery rate (FDR) of 11%.
B Benchmark quality metrics of putative complexes (this work) versus other interactome maps. Bar length reflects total composite score, calculated as the sum of complex maximal matching ratio, overlap, and accuracy (see STAR methods) relative to select reference curated brain macromolecules.
C Bar chart of categorized complexes (partial or complete match to annotated assemblies vs novel).
D Highly significant (hypergeometric p-values) overlap of predicted complexes with annotated assemblies compared to randomized protein sets.
E Schematic of protein assemblies in BraInMap, sorted according to novelty, showing the distribution of neuron-associated components (purple).
F ROC analysis of predicted co-complex interactions showing high agreement with previously reported high confidence orthologous human protein interactions in the InWeb database (Li et al., 2017).
G Enrichment of human orthologs of BraInMap complex subunits relative to randomized protein pairs for highly correlated co-fractionation profiles of SHSY5Y neuronal cell extracts.
H Enrichment of human orthologs of interacting proteins in BraInMap relative to random pairs for high functional ‘co-fitness’ scores (Pan et al., 2018).
I Median expression of orthologs of BraInMap components during development of the human cortex; lines indicate levels of all interacting components (red) versus the subset associated with risk for schizophrenia (olive)(Schizophrenia Working Group of the Psychiatric Genomics et al., 2014), autism (green)(Sanders et al., 2015), or other neurodevelopmental disorders (cyan)(Deciphering Developmental Disorders et al., 2017), as compared to random proteins (magenta).
J Schematic of protein domains enriched in BraInMap. Complexes (nodes) sharing two or more domains are joined according to overlap (Jaccard Index). Colors reflect the proportion of domains restricted to brain (blue) or linked to neuropathology (red). Highlighted bipartite subnetwork shows relationship between subunits (ellipses) and domains (diamonds) of a representative assembly (complex 20).
K Annotation enrichment (DAVID; (Huang da et al., 2009) in BraInMap relative to previous interactome studies: Gene Ontology (i) cellular component or (ii) biological process terms, or (iii) PFAM domains (Finn et al., 2016).
