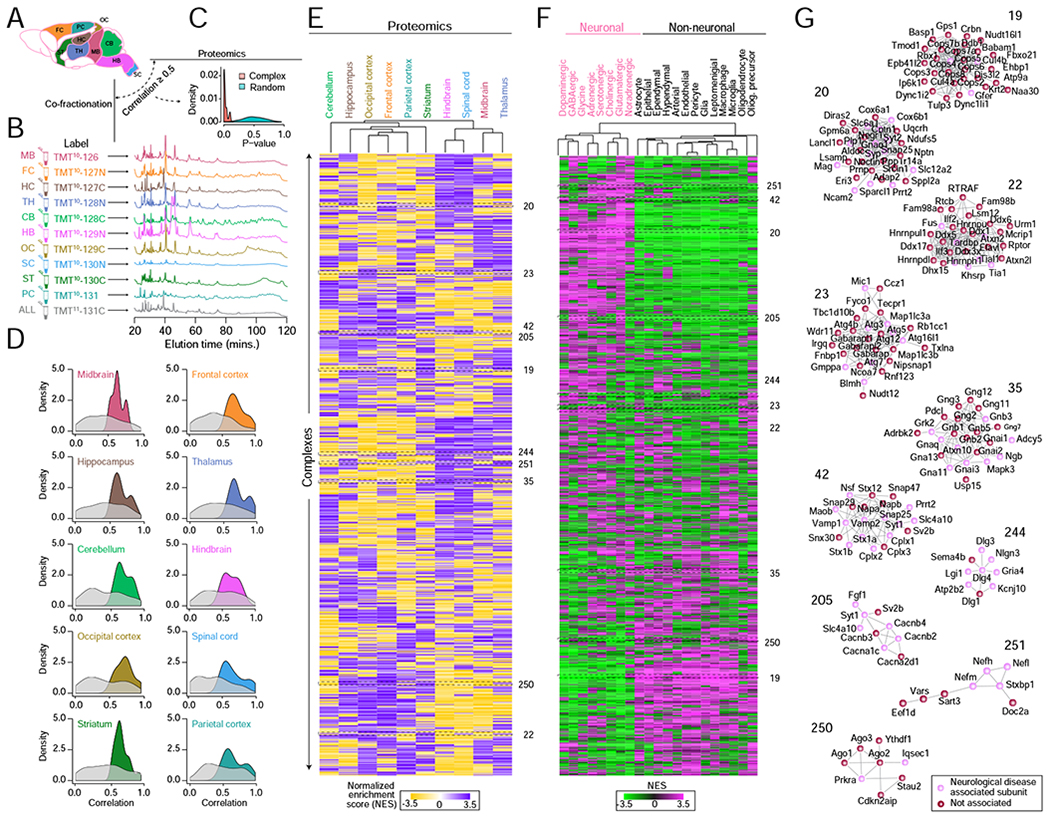
Figure 3 – Regional- and cell-type selective macromolecules.

A Schematic of 10 mouse brain regions subjected to quantitative proteomic profiling and biochemical (HPLC-IEX) fractionation in parallel.
B Representative chromatograms and isobaric (TMT) labeling of fractionated regional assemblies.
C Highly significant (hypergeometric) agreement between the regional abundance patterns recorded by quantitative profiling versus co-fractionation of BraInMap components (derived by whole tissue analysis) as compared to randomized protein sets.
D Complex subunits with highly correlated regional co-fractionation profiles also show significantly co-enrichment (hypergeometric p-value ≤ 0.05, relative to randomized protein pairs) in the same brain compartments as determined by quantitative proteomics (E).
E Heatmap clustergram showing complex regional specificity (enrichment P-value ≤ 0.01 by Kolmogorov–Smirnov test) as measured by quantitative proteomics.
F Heatmap clustergram of complexes showing preferential (P ≤ 0.01 by KS test after normalization) component mRNA expression in neuronal versus non-neuronal cell classes based on recently published mouse brain scRNA-seq data (Zeisel et al., 2018).
G Representative complexes displaying regional (proteomic) and neuronal cell-type (scRNAseq) specificity. Highlighted (red) nodes represent subunits associated with neurological disorders.
