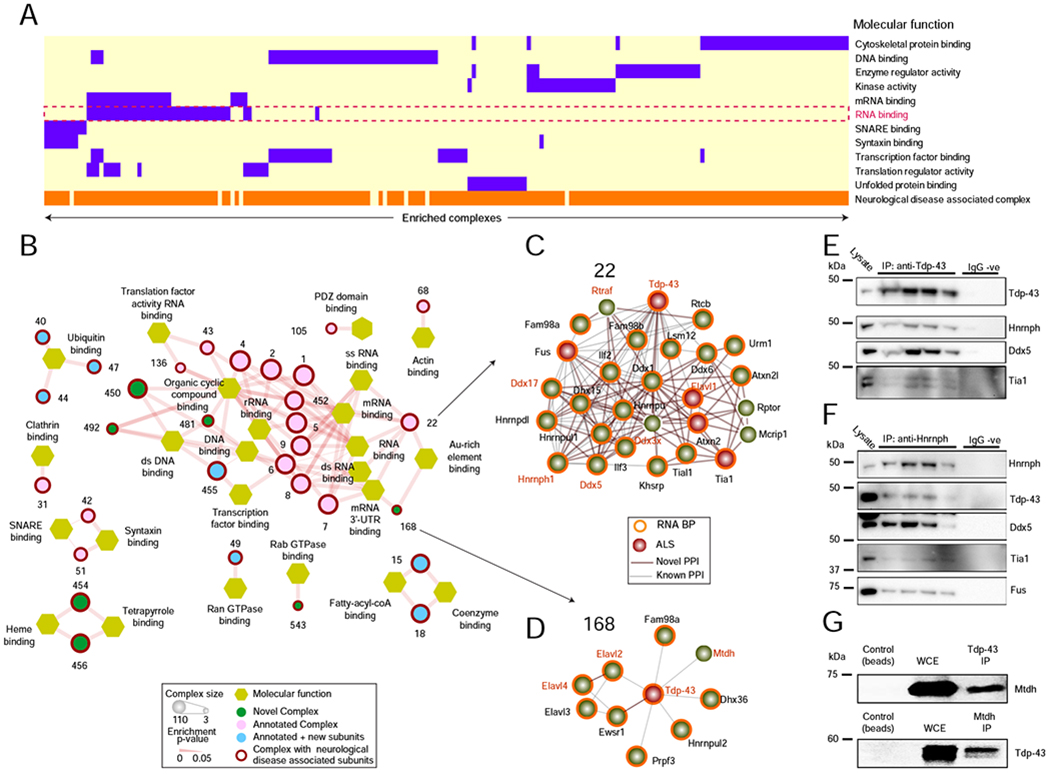
Figure 5 – BraInMap identifies complexes with diverse functions.

A BraInMap complexes enriched for RNA-binding (dashed box), other annotation terms (purple), and disease associations (orange).
B Sub-network of RNA-related complexes (olive); outline (red) indicates a link to neurological disorder.
C Putative module (complex 22), composed of 28 RBPs (orange) with links to ALS (red).
D Co-Immunoprecipitation (Western blot) analysis of endogenous Tdp-43 confirms physical associations with Hnrnph, Ddx5, and Tia1 (doublet). Lysate and replicate pulldowns provided; no non-specific signal observed using rabbit or mouse IgG (IgG −ve).
E Co-IP analysis of endogenous Hnrnph confirms interactions with Tdp-43, Ddx5, Tia1, and FUS/TLS.
F Complex 168 (Tdp-43 co-complexed with Elavl2/3/4, Ewsr1, Fam98a, Dhx36, Hnrnpul2,Mdth, Prpf3).
G Reciprocal co-IP analysis confirms the association of Mtdh with Tdp-43 in the mouse brain.
