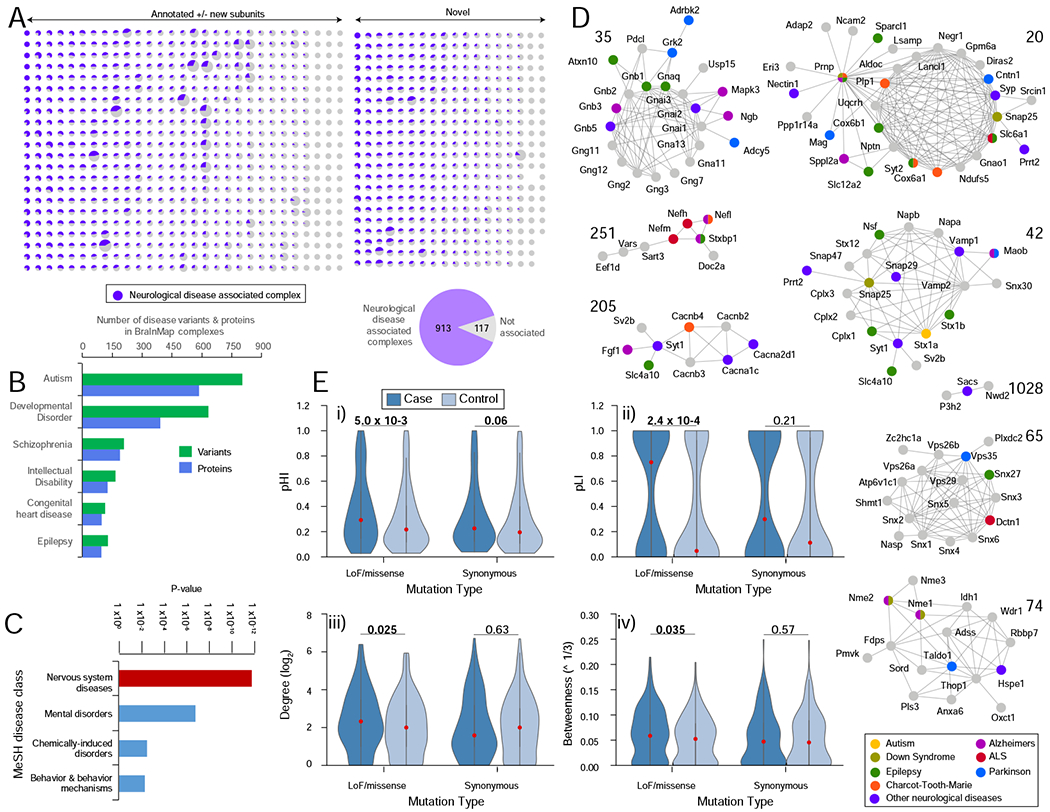
FIGURE 7 – Macromolecular links to neurological disorders.

A Putative pathophysiological relevance of complexes in BraInMap. Proportion (purple) of subunits of each assembly linked to neurological impairment (see Table S6 for details).
B Number of BraInMap components (orthologs) and corresponding human genetic variants associated with specific neuropathologies (see Table S5).
C Enrichment (hypergeometric p-value) of complex subunits with links to neuropathology as annotated in DisGeNET (Pinero et al., 2017).
D Representative complexes associated with Alzheimer’s (magenta), autism (yellow), amyotrophic lateral sclerosis (red), epilepsy (green), Down syndrome (olive), Charcot-Toothe-Marie syndrome (orange), Parkinson’s (blue), or other neurological disorders (purple).
E Enrichment of genes encoding BraInMap components harboring de novo variants for (i) haploinsufficiency (pHI) and (ii) pLI (probability a gene is intolerant to loss of function (LoF) mutations) versus synonymous variants in affected individuals in comparison to unaffected controls; (iii) network degree and (iv) betweeness of genes with de novo LoF/missense or synonymous mutations in neurodevelopmental disorder afflicted individuals or unaffected controls. Violin plot width proportional to protein abundance (red dot, median); P-values (one-tailed U-test; P< 0.05 in bold) shown at the top.
