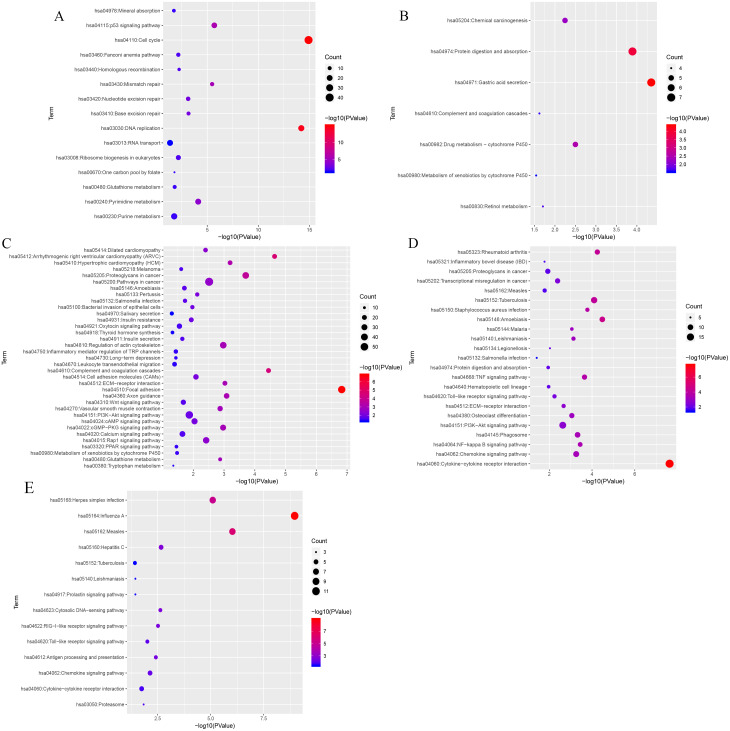
Figure 7. KEGG pathway enrichment analyses of the (A) blue, (B) black, (C) turquoise, (D) greenyellow and (E) salmon modules.
The negative logarithm of the p-value is assigned to the x-axis and the term of each pathway to the y-axis. The size of the bubble shows the numbers of the genes enriched in each pathway, while the colors indicate the enrichment significance (from blue to red designated as less to high significance).

