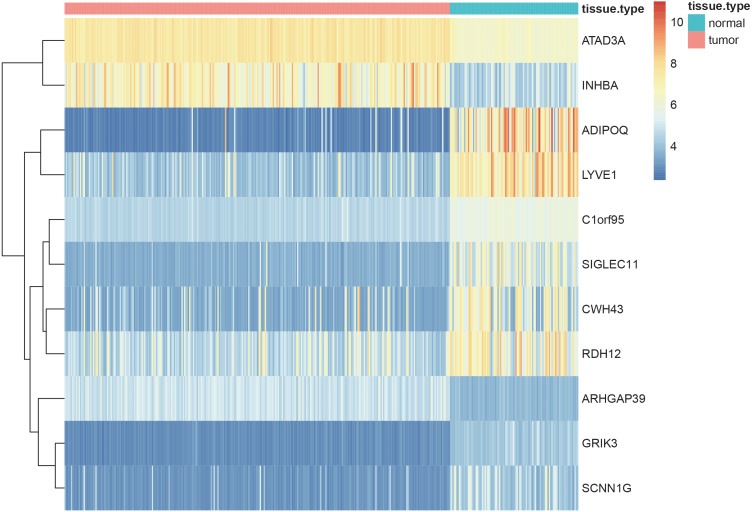
Figure 8. Heatmaps showing the expressopms pf 11 hub genes between the gastric cancer patients and normal controls in training set.
The x- and y-axes present the samples and genes, respectively. In the x-axis, pink and green represent the gastric cancer and normal samples, respectively. The scale bar from blue to red represented low to high expressions of each gene in each sample.

