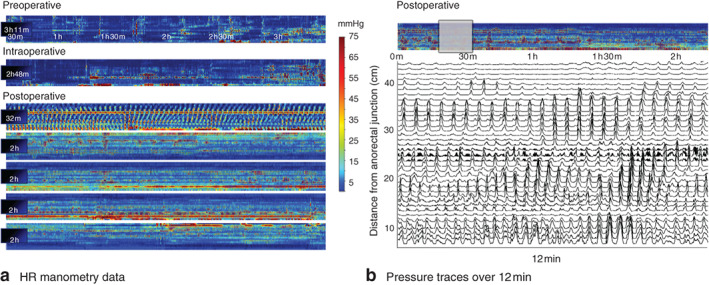
Fig. 2.

a Representative high-resolution (HR) colonic manometry data from one patient, demonstrating pressure profiles across the preoperative, intraoperative and postoperative periods (total 14·5 h of data shown). The colour plots demonstrate pressure (scale bar) across the 36-channel manometry device, arranged from proximal (top of plot) to distal (bottom) bowel. An intense cyclic motor pattern hyperactivity is seen to arise in the preoperative period, increasing during the procedure and sustained throughout a larger area of the colon across the entire postoperative period. b Pressure traces during a representative 12-min postoperative window in the same patient. The selected period is indicated by the grey box above the pressure plots. Each pressure trace relates to a single manometry channel, arranged according to distance from the anorectal junction (top channel proximal)
