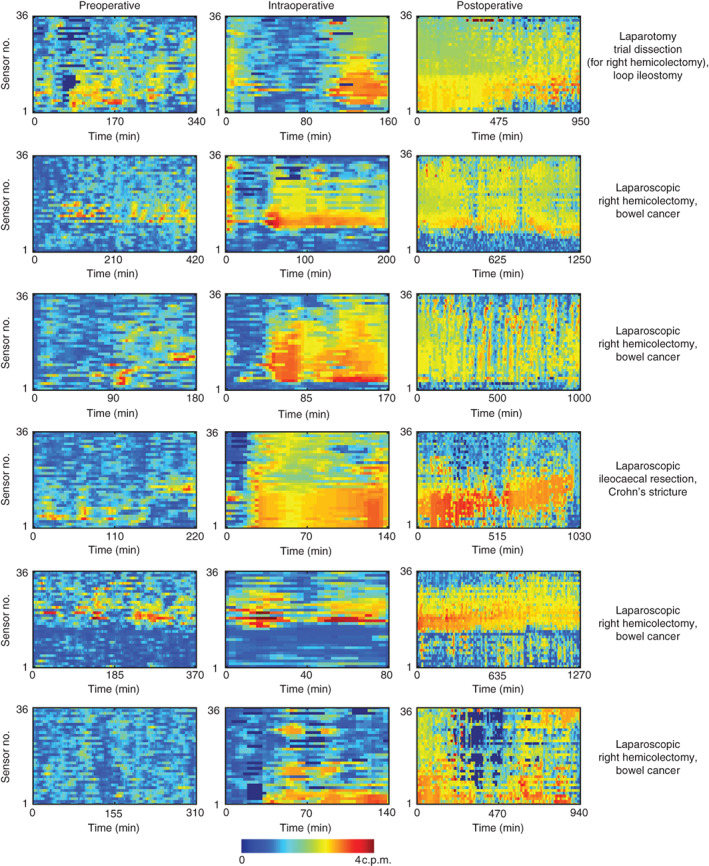
Fig. 5.

Frequency maps for six representative patients across the preoperative, intraoperative and postoperative recording periods, generated by fast Fourier transform analysis. Frequency (colour scale) is shown for each manometry channel (top proximal; bottom distal). Cyclic motor events generally occurred within a range of 2–4 c.p.m. and were consistent in all patients regardless of the operation
