Figure 2.

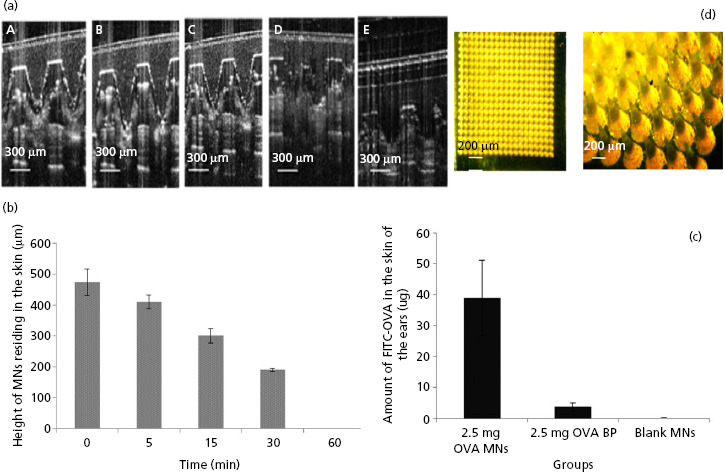
(a) Optical coherence tomography (OCT) real-time in-vivo visualisation of microneedle (MN), fabricated from 20% w/v poly(methyl vinyl ether/maleic acid) (PMVE/MA) and loaded with 2.5 mg ovalbumin (OVA), inserted into the ear of mice for increasing application times: i.e. 1 min (A), 5 min (B), 15 min (C), 30 min (D) and (E) 60 min. (b) Dissolution profile of MN arrays (calculated as reduction of MN height) inserted into mouse skin at increasing application times (mean ± SD, n = 15). (c) The amount (μg) of fluorescently labelled OVA (FITC-OVA) quantified in the excised ear skin of mice that were treated with MN arrays loaded with 2.5 mg FITC-OVA (2.5 mg OVA MNs); baseplates (arrays lacking needles) loaded with 2.5 mg FITC-OVA (2.5 mg OVA BP) or blank MN arrays containing no FITC-OVA (blank MNs). Data are presented as mean ± standard deviation (SD), n = 4. (d) A representative light micrograph of a portion of a MN array prepared from aqueous blends of 20% w/v PMVE/MA and loaded with 2.5 mg of FITC-OVA. The scale bar represents 200 μm.
