
Figure 4.
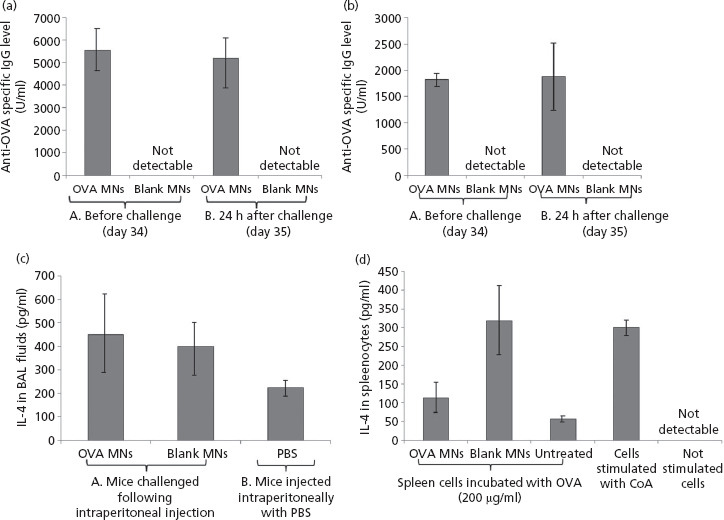
Levels of anti- ovalbumin (OVA)-specific total IgG (a) and IgG1 (b) of C57BL/6 mice before and after intraperitoneal challenge with OVA. Mice were immunised twice (at day 0 and day 14) with microneedle (MN) arrays loaded with 2.5 mg OVA/array or MN arrays devoid of OVA (blank MNs) as a control group. At day 34 before challenge, mice were bled to determine the levels of antibodies in their systems. Mice were then challenged intraperitoneal with 2 mg OVA in a volume of 100 μl phosphate-buffered saline (PBS) and blood samples were collected 24 h after challenge to monitor the levels of antibodies produced in response to the challenge. Brace A indicates the levels pre-challenge while Brace B indicates the total IgG levels and the IgG1 levels post-challenge. Data are presented as mean ± SD, n = 3. Detection of the Th2 cytokine, IL-4, in BAL fluids (c) and in cultured splenocytes (d). C57BL/6 mice were immunised twice with OVA loaded MN arrays at 2.5 mg/array, then challenged intraperitoneal with OVA (2 mg in 100 μl PBS). The control group consisted of mice treated with control MN arrays (blank MNs) before challenge. A second control group were injected with 100 μl PBS (PBS) only. Data are represented as mean ± standard deviation (SD), n = 3.