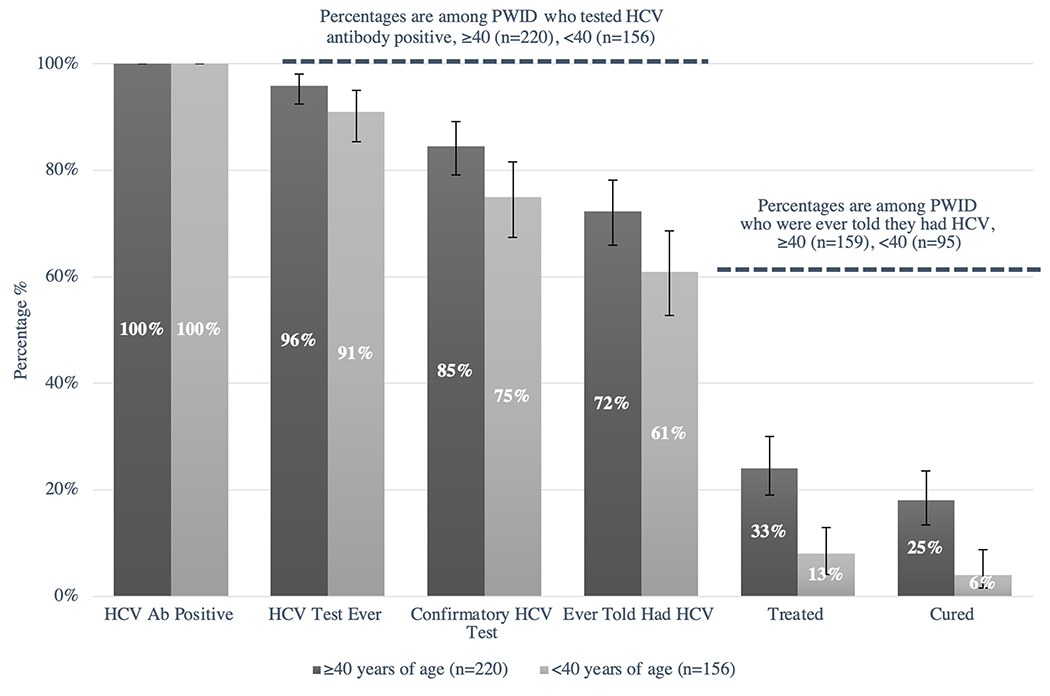
Figure 2. Hepatitis C Continuum of Care Among Seattle Area PWID by Age, 2018 NHBS.

PWID 40 years of age and older are depicted in the dark gray columns. PWID less than 40 years of age are depicted in the light gray columns. Column 1: Total number of HCV antibody positive PWID ≥40 years of age (n= 220, 100%) and <40 years of age (n=156, 100%). Column 2: Proportion of HCV antibody positive PWID who report any prior test for HCV (≥40 years of age n=211, 96%; <40 years of age n=142, 91%). Column 3: Proportion of HCV antibody positive PWID who report a prior confirmatory test for HCV (≥40 years of age n=186, 85%; <40 years of age n=117, 75%). Column 4: Proportion of HCV antibody positive PWID who report a prior diagnosis of HCV (≥40 years of age n=159, 72%; ,40 years of age n=95, 61%). Column 5: Proportion of HCV antibody positive PWID with a prior diagnosis of HCV who report treatment for HCV (≥40 years of age n= 53, 33%; <40 years of age n=12, 13%). Column 6: Proportion of HCV antibody positive PWID with a prior diagnosis of HCV who report being cured of HCV (≥40 years of age n=40, 25%; <40 years of age n=6, 6%). Black error bars represent 95% confidence intervals for column percentages.
