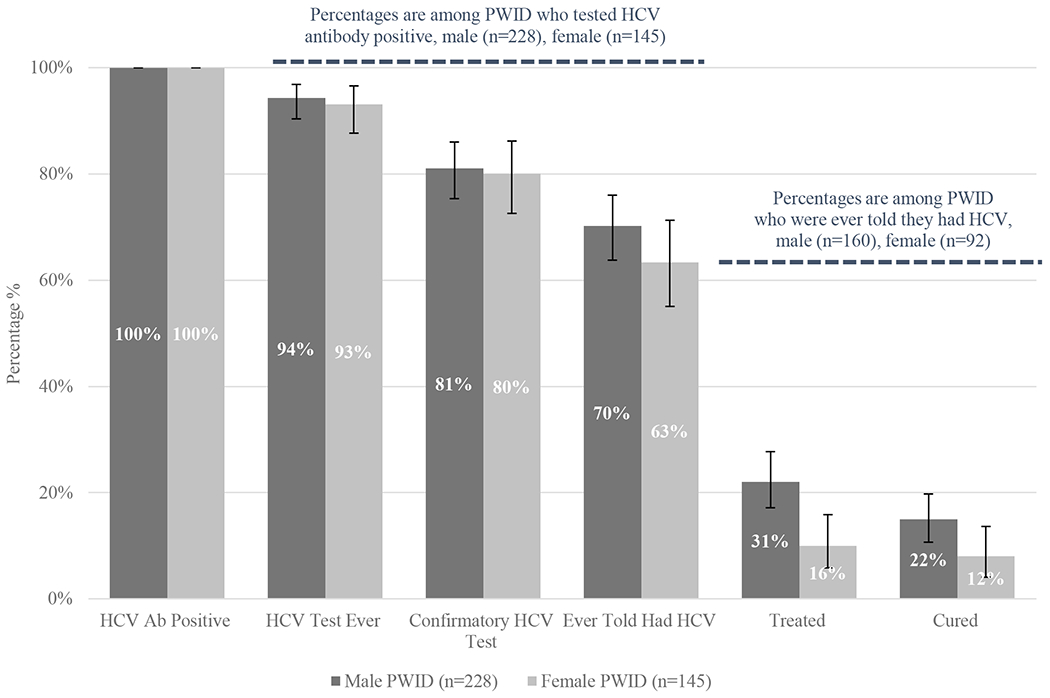
Figure 3. Hepatitis C Continuum of Care Among Seattle Area PWID by Gender, 2018 NHBS.

Male PWID are depicted in the dark gray columns. Female PWID are depicted in the light gray columns. Column 1: Total number of HCV antibody positive male PWID (n= 228, 100%) and female PWID (n=145, 100%). Column 2: Proportion of HCV antibody positive PWID who report any prior test for HCV (males n=215, 94%; females n=135, 93%). Column 3: Proportion of HCV antibody positive PWID who report a prior confirmatory test for HCV (males n=185, 81%; females n=116, 80%). Column 4: Proportion of HCV antibody positive PWID who report a prior diagnosis of HCV (males n=160, 70%; females n=92, 63%). Column 5: Proportion of HCV antibody positive PWID with a prior diagnosis of HCV who report treatment for HCV (males n=50, 31%; females n=15, 16%). Column 6: Proportion of HCV antibody positive PWID with a prior diagnosis of HCV who report being cured of HCV (males n=35, 22%, females n=11, 12%). Black error bars represent 95% confidence intervals for column percentages.
