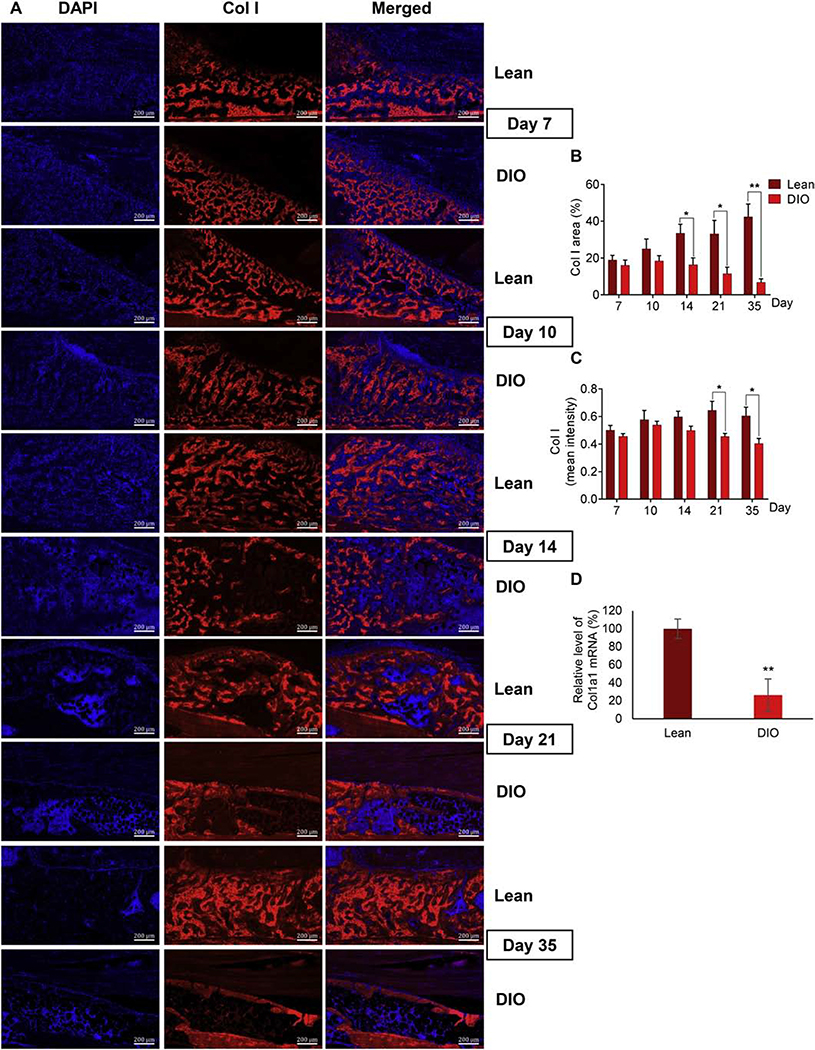
Fig. 5.
Col I content is lower in DIO callus than lean callus. (A) Representative images of IF staining of Col I (red) in callus tissues isolated from either lean or DIO mice at the indicated post-fracture time points. DAPI stains nuclei (blue). Scale bar = 200μm. (B) Quantitation of Col I-stained area in IF images. Col I-stained area was normalized to the total-callus area and presented as area (%). (C) Quantitation of the mean intensity of Col I staining in IF images. IF Analysis was performed in 6 lean and 6 DIO callus tissues; 3 sections were analyzed in each. (D) RT-qPCR quantitation of Col1a1 mRNA (normalized to the level of β-actin mRNA). Quantitation was done on RNA purified from lean and DIO callus tissues at d35 post-fracture (n=3). Normalized level in lean callus is defined as 100. All bar graphs represent average ± SEM. (*) P < 0.05; (**) P < 0.01 using student t-test and time-matched lean callus as a control.

