Fig. 6.
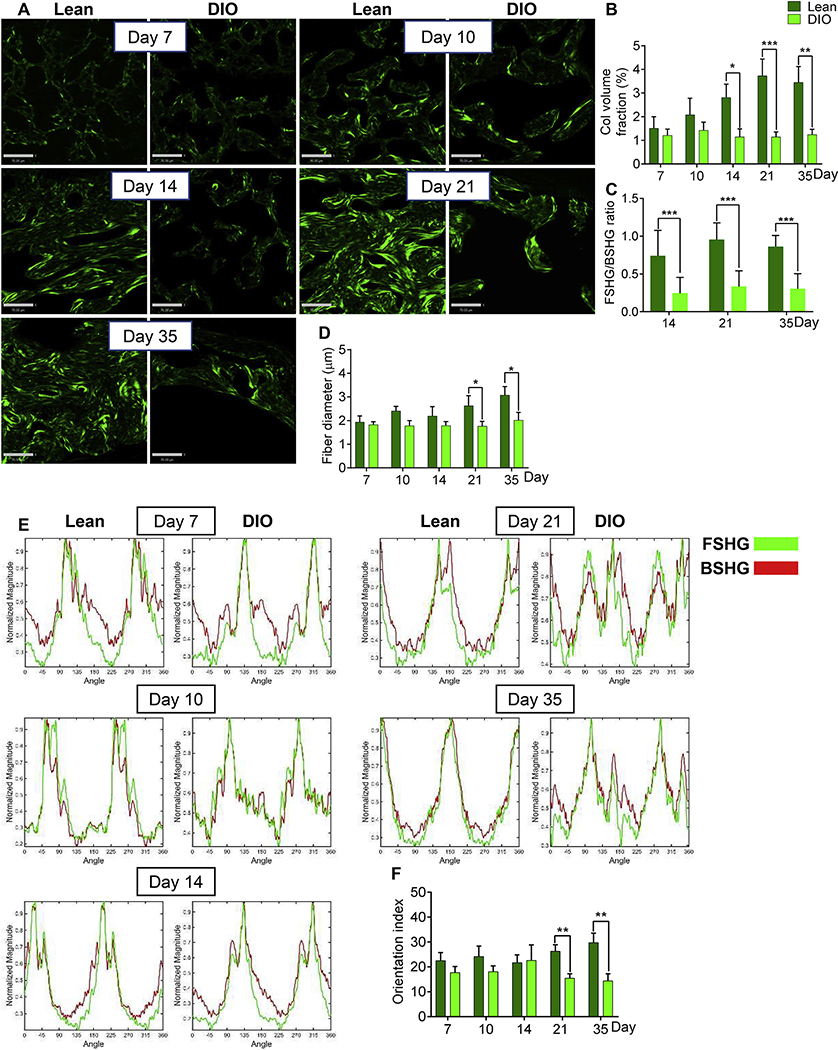
Collagen fibers in the woven-bone area of DIO callus have abnormally small diameter and low orientation index. (A) Representative FSHG images of fibrillar collagen in the woven-bone area of either lean or DIO callus. Images were captured at the indicated post-fracture time points. Scale bar = 70μm. (B) Quantitation of collagen volume fraction in FSHG images. Collagen volume fraction was determined as in Fig. 3B. (C) The FSHG/BSHG ratio was calculated at the specified post-fracture time points using the same ROIs utilized to generate data shown in (B). (D) Quantitation of collagen-fiber diameter in the woven-bone area. Fiber diameter was determined as in Fig. 3E. (E) Representative examples of FT power spectra generated as in Fig. 3C. (F) Quantitation of the orientation index of woven-bone fibrillar collagen. Orientation index was computed as in Fig. 3D.
For all analyses, IF images shown in Fig. 2A and Fig. 5A were used as a guide to choose ROIs. All bar graphs represent average ± SEM. (*) P < 0.05; (**) P < 0.01; (***) P < 0.001 using student t-test and time-matched lean callus as a control.

