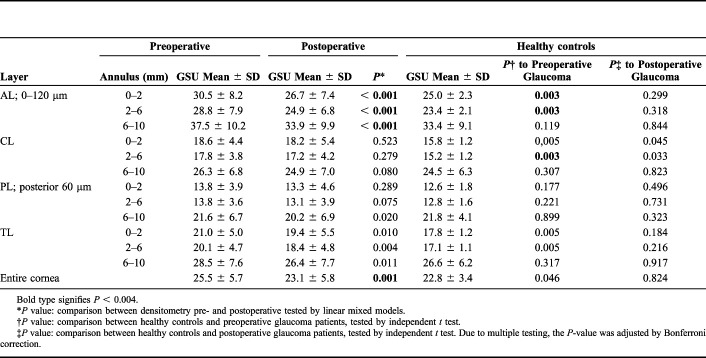
TABLE 2.
Scheimpflug Densitometry Measuring Corneal Backscatter Before and After Trabeculectomy and in Healthy Age-Matched Controls
| Layer | Preoperative | Postoperative | Healthy controls | ||||
| Annulus (mm) | GSU Mean ± SD | GSU Mean ± SD | P* | GSU Mean ± SD | P† to Preoperative Glaucoma | P‡ to Postoperative Glaucoma | |
| AL; 0–120 μm | 0–2 | 30.5 ± 8.2 | 26.7 ± 7.4 | < 0.001 | 25.0 ± 2.3 | 0.003 | 0.299 |
| 2–6 | 28.8 ± 7.9 | 24.9 ± 6.8 | < 0.001 | 23.4 ± 2.1 | 0.003 | 0.318 | |
| 6–10 | 37.5 ± 10.2 | 33.9 ± 9.9 | < 0.001 | 33.4 ± 9.1 | 0.119 | 0.844 | |
| CL | 0–2 | 18.6 ± 4.4 | 18.2 ± 5.4 | 0.523 | 15.8 ± 1.2 | 0,005 | 0.045 |
| 2–6 | 17.8 ± 3.8 | 17.2 ± 4.2 | 0.279 | 15.2 ± 1.2 | 0.003 | 0.033 | |
| 6–10 | 26.3 ± 6.8 | 24.9 ± 7.0 | 0.080 | 24.5 ± 6.3 | 0.307 | 0.823 | |
| PL; posterior 60 μm | 0–2 | 13.8 ± 3.9 | 13.3 ± 4.6 | 0.289 | 12.6 ± 1.8 | 0.177 | 0.496 |
| 2–6 | 13.8 ± 3.6 | 13.1 ± 3.9 | 0.075 | 12.8 ± 1.6 | 0.221 | 0.731 | |
| 6–10 | 21.6 ± 6.7 | 20.2 ± 6.9 | 0.020 | 21.8 ± 4.1 | 0.899 | 0.323 | |
| TL | 0–2 | 21.0 ± 5.0 | 19.4 ± 5.5 | 0.010 | 17.8 ± 1.2 | 0.005 | 0.184 |
| 2–6 | 20.1 ± 4.7 | 18.4 ± 4.8 | 0.004 | 17.1 ± 1.1 | 0.005 | 0.216 | |
| 6–10 | 28.5 ± 7.6 | 26.4 ± 7.7 | 0.011 | 26.6 ± 6.2 | 0.317 | 0.917 | |
| Entire cornea | 25.5 ± 5.7 | 23.1 ± 5.8 | 0.001 | 22.8 ± 3.4 | 0.046 | 0.824 | |
Bold type signifies P < 0.004.
P value: comparison between densitometry pre- and postoperative tested by linear mixed models.
P value: comparison between healthy controls and preoperative glaucoma patients, tested by independent t test.
P value: comparison between healthy controls and postoperative glaucoma patients, tested by independent t test. Due to multiple testing, the P-value was adjusted by Bonferroni correction.

