Figure 1.

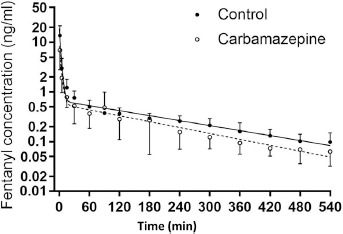
Mean (±standard error) plasma fentanyl concentrations at corresponding times in the control patients and in the carbamazepine-treated patients. Lines represent the pharmacokinetic functions determined by nonlinear regression analysis.

Mean (±standard error) plasma fentanyl concentrations at corresponding times in the control patients and in the carbamazepine-treated patients. Lines represent the pharmacokinetic functions determined by nonlinear regression analysis.