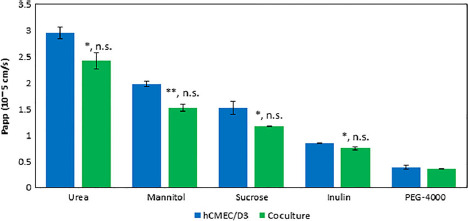
Figure 3.

Apparent permeability for five paracellular [14C]-labelled markers of various hydrodynamic radii. Studies were run in triplicate and subjected to Student's t-test or Mann–Whitney test. Significant changes are noted with an asterisk (*) for P < 0.05 and (**) for P < 0.01. Significant levels are reported as (t-test, MW). Error bars represent 1 standard deviation (n = 3).
