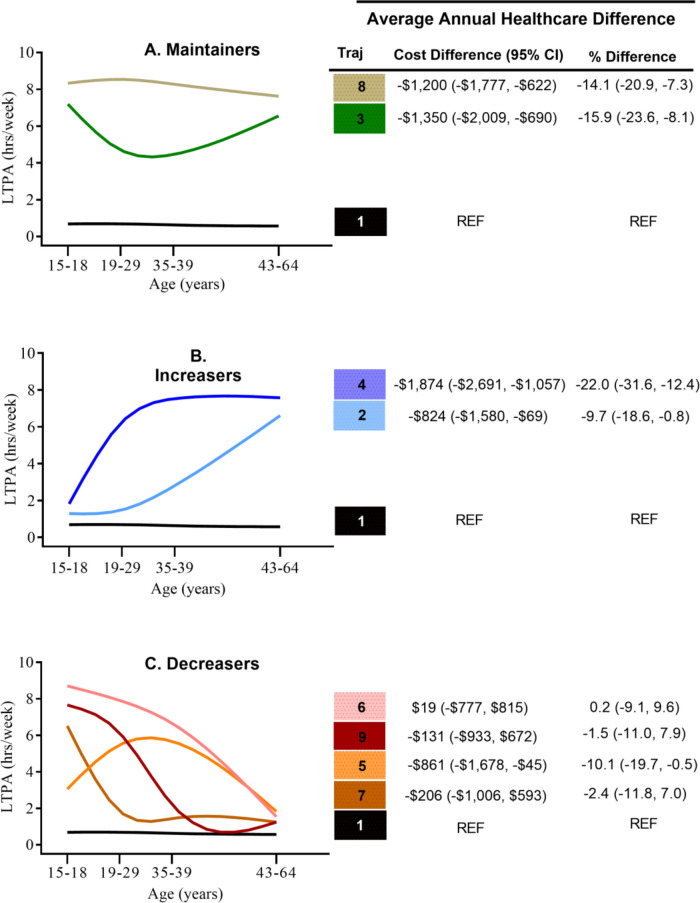
Figure 1.
Association between LTPA trajectory and average annual healthcare cost in later life in 1999–2008. Adjusted for age, sex, marital status, race/ethnicity, education attainment, smoking status, BMI at age 18, location of residence and television viewing status (model 1). Per cent difference calculated using recycled predictions of adjusted reference group (reference group: Traj 1 US$8453/year). BMI, body mass index; LTPA, long-term leisure time physical activity.

