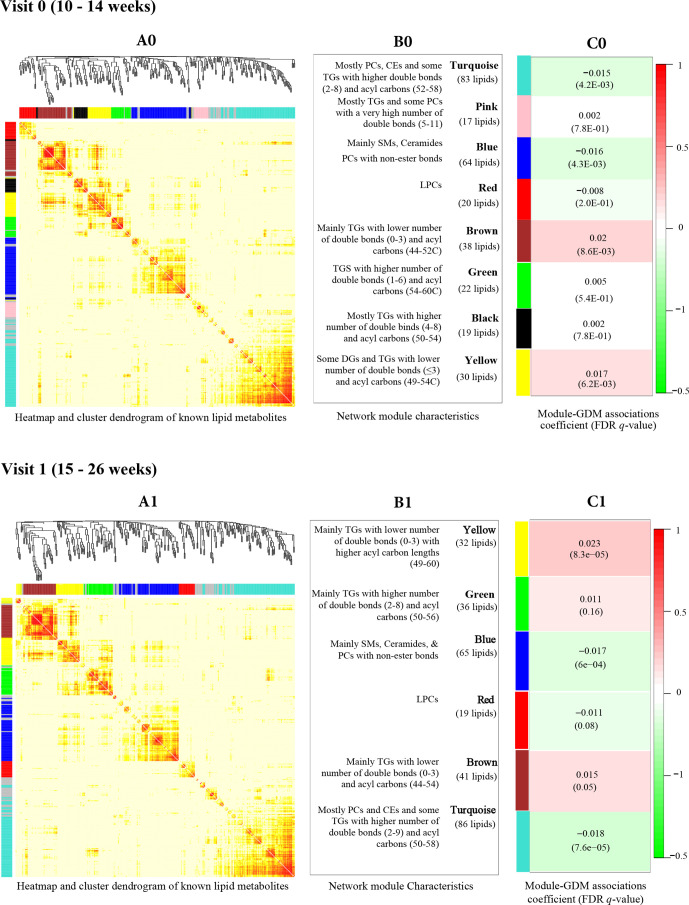
Figure 1.
Lipid networks represented by correlated metabolites, as shown in cluster dendrogram and heatmap at visit 0 (A0) and visit 1 (A1). We constructed eight lipid networks at visit 0 (B0) and six networks at visit 1 (B1) from 328 annotated lipid metabolites using weighted correlation network analysis algorithm. Constituents of each lipid network are presented. The associations between lipid networks and GDM risk (coefficient (FDR)) using linear mixed effect models, adjusted for maternal age, enrollment BMI, family history of diabetes, alcohol use before pregnancy, race/ethnicity and gestational age at blood collection at visit 0 (C0) and visit 1 (C1) are presented. BMI, body mass index; CE, cholesteryl ester; FDR, false discovery rate; GDM, gestational diabetes; LPC, lysophosphatidylcholine; PC, phosphatidylcholine; SM, sphingomyelin; TG, triglyceride.

