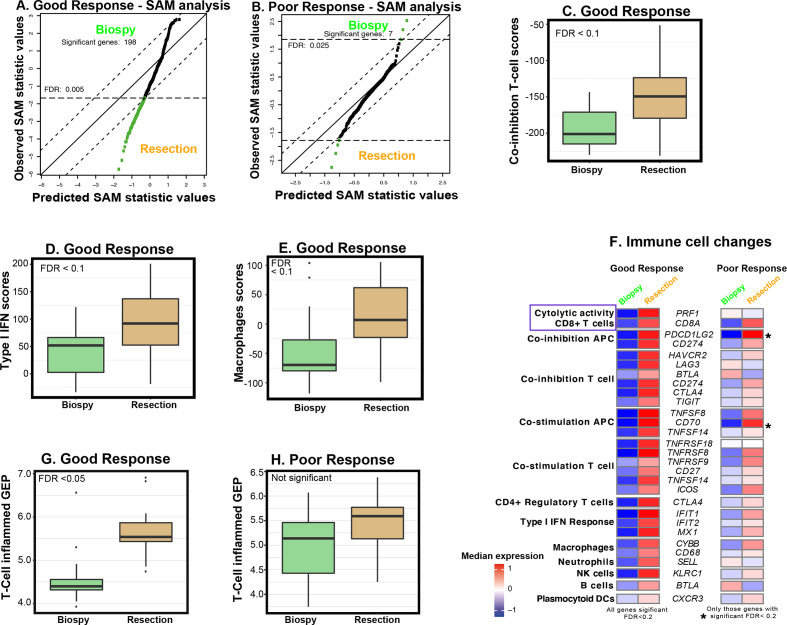
Figure 6.
Longitudinal analysis of changes in immune gene expression in matched preradiotherapy diagnostic biopsy and postradiotherapy resection specimen. (A, B) Significance analysis of microarrays (SAM) plot to show 198 genes with a significant difference in expression between pre-RT biopsy and post-RT resection in tumors with a good response (A) and those with a poor response (B). Four upregulated genes during RT in (B) include C7, CHIT1, CXCL12 and SPP1 while downregulated genes during RT include CCL28, DMBT1 and CEACAM1. Significant genes are shown in green while non-significant genes are shown in black. (C–E) Box plots showing changes in immune enrichments scores (IES)30 for T cell coinhibition (C), type I interferon (IFN) (D) and macrophages (E) between pre-RT biopsies and post-RT resection specimens in tumors showing a good RT response. (F) Heatmaps to show changes in significant IES in pre-RT biopsies and post-RT resection specimens in tumors showing a good RT response and a poor RT response. Certain genes were repeated depending on their immune cell type/regulation categories. A blue box highlights increased cytolytic activity and CD8+ T cells in post-RT resection samples compared with pre-RT biopsy samples. (G, H) Change in the T-cell-inflamed GEP28 between pre-RT biopsy and post-RT resection in good responders (G) and poor responders (H).

