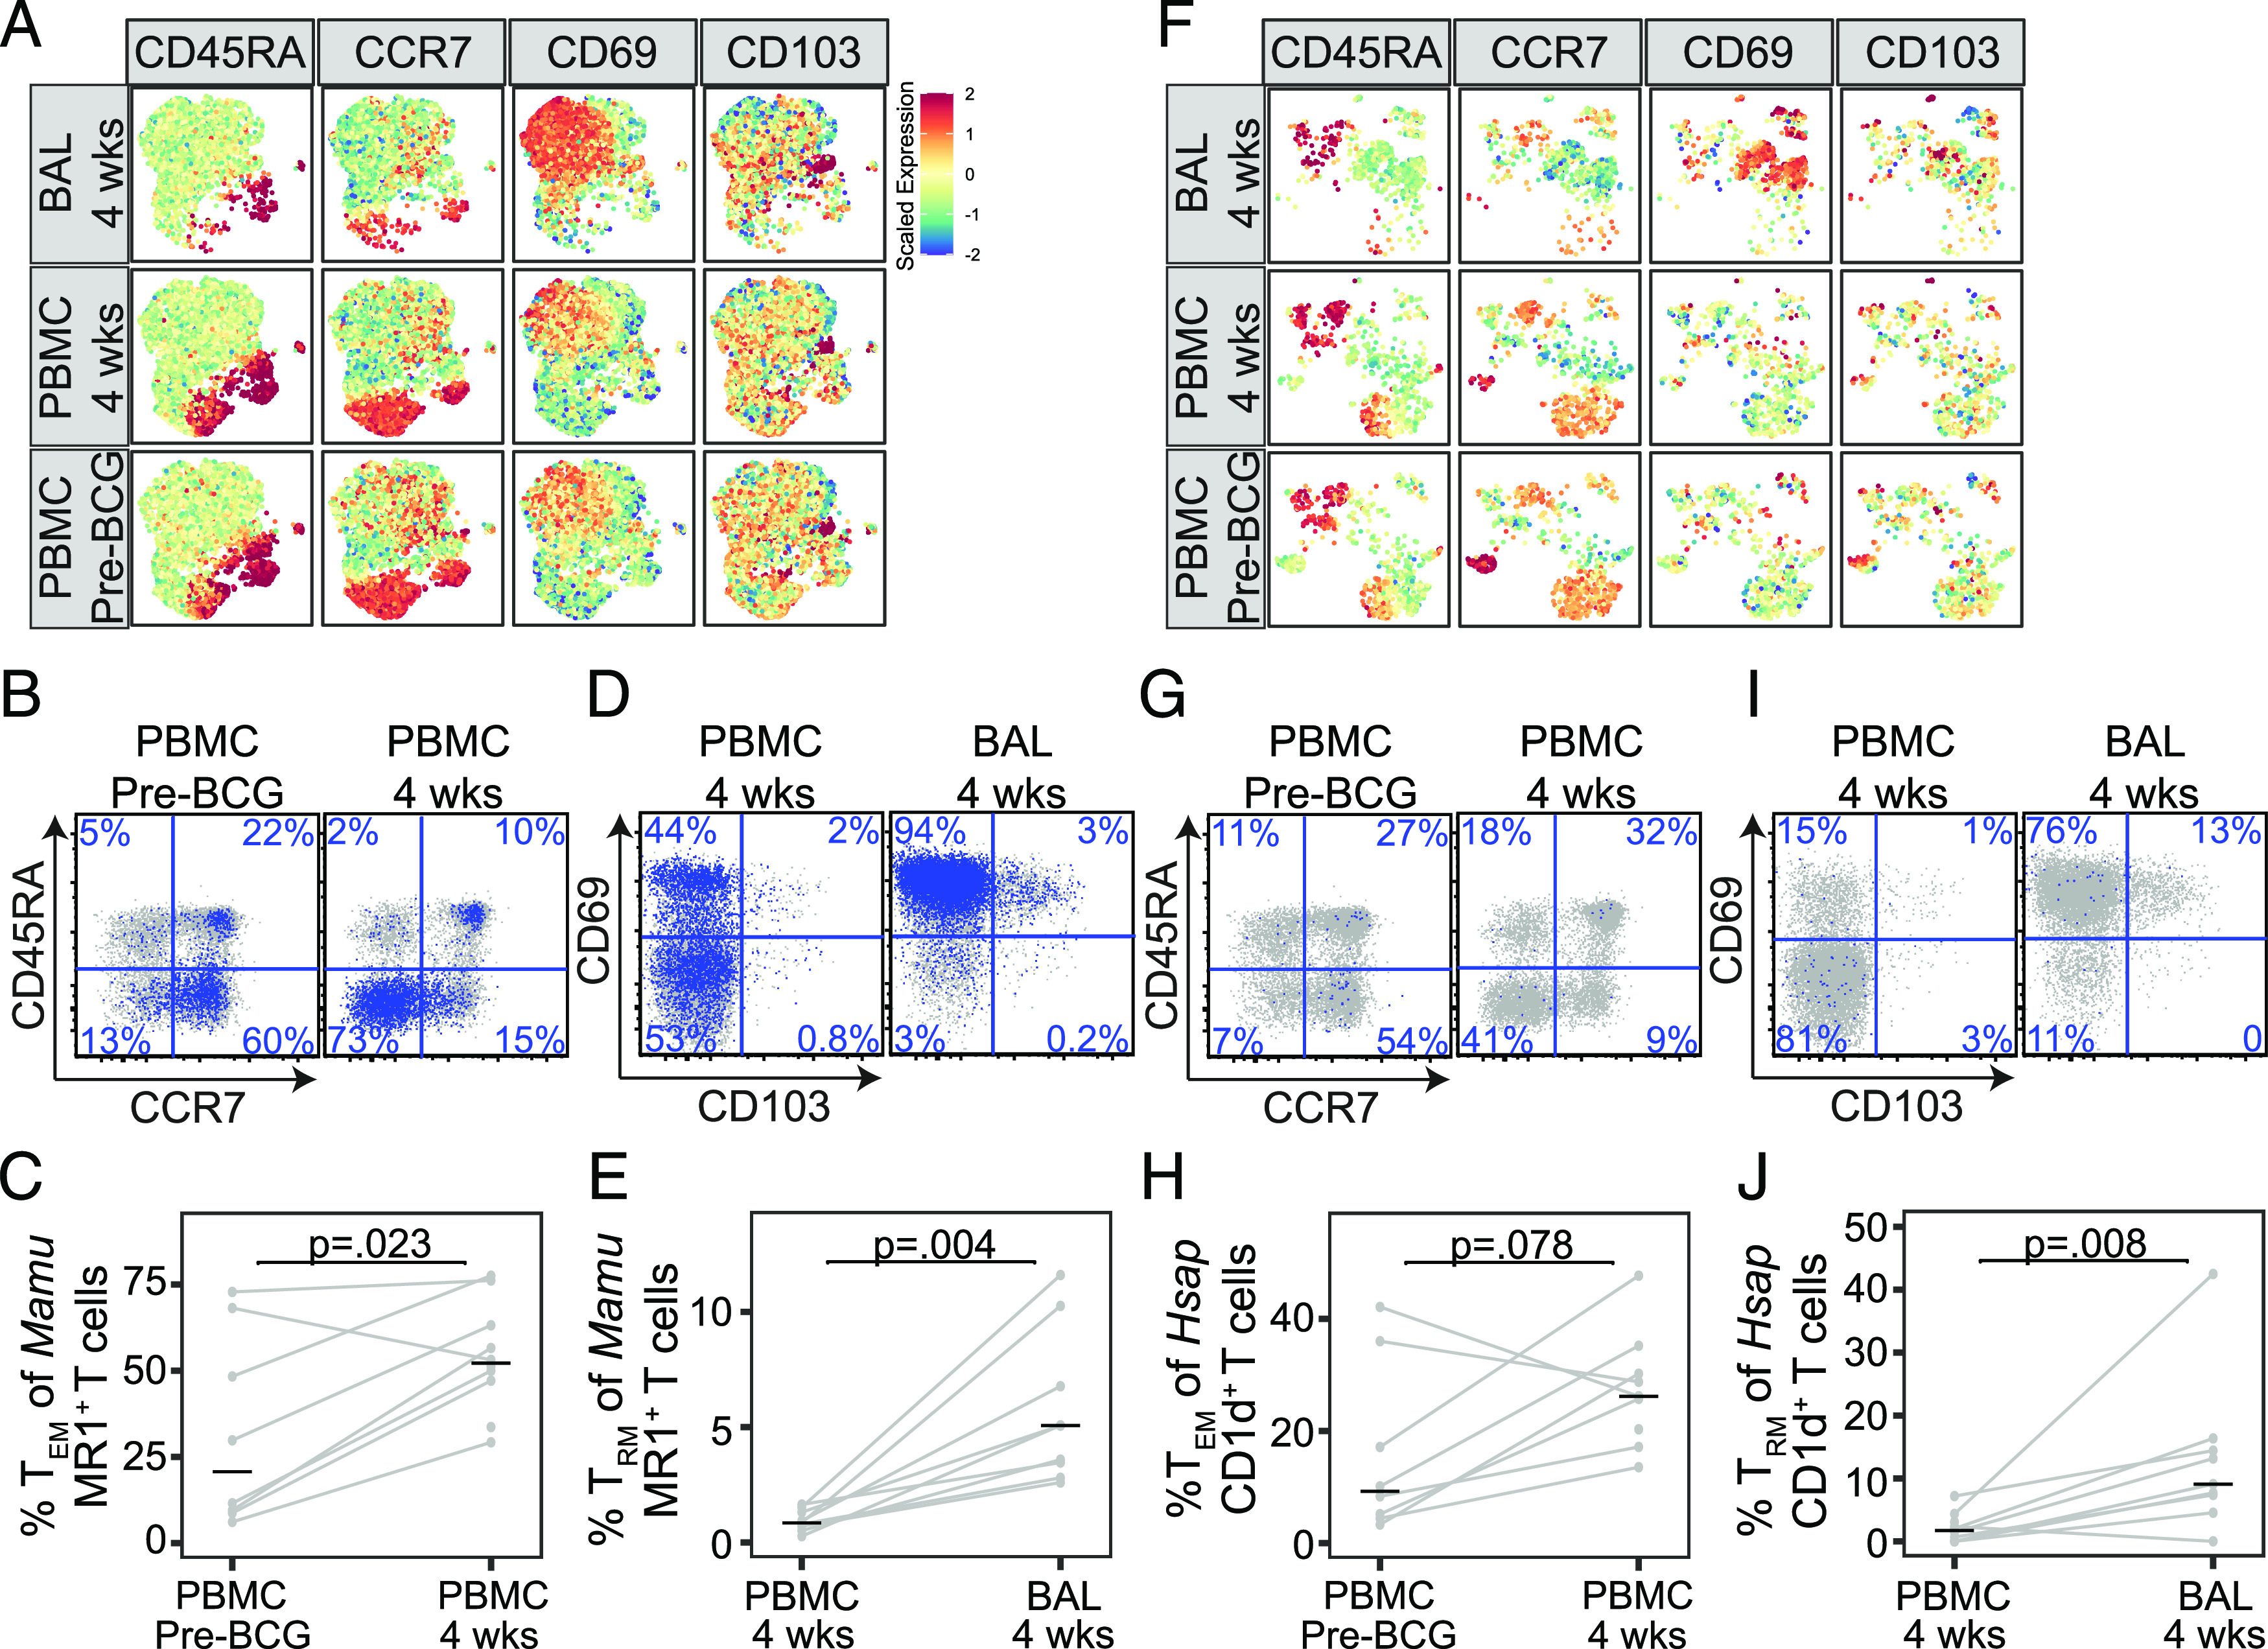
FIGURE 4.

Resident memory MAIT and iNKT cells are present in macaque lungs after i.v. BCG. Multiparameter flow cytometry was used to profile T cells present in PBMC prior to i.v. BCG vaccination (pre-BCG) and in PBMC and BAL at 4 wk after BCG vaccination in 10 rhesus macaques. MAIT cells were identified using Mamu MR1–5-OP-RU loaded tetramer and iNKT cells were identified using H. sapiens CD1d–α-GalCer–loaded tetramer. (A) Expression of CD45RA, CCR7, CD69, and CD103 on MAIT cells is displayed after aggregating across all animals and performing dimensionality reduction with UMAP. Mean fluorescence intensities (MFI) were scaled to achieve a mean = 0 and SD = 1. (B) Representative staining of CD45RA and CCR7 among CD8+ MAIT cells identified in PBMC from one animal pre-BCG or 4 wk after i.v. BCG vaccination. (C) The frequency of CD4+ and CD8+ MAIT cells expressing a TEM phenotype was compared with pre-BCG and at 4 wk after i.v. BCG vaccination in all 10 animals. (D) Representative staining of CD69 and CD103 among CD8+ MAIT cells identified in PBMC and BAL at 4 wk after i.v. BCG vaccination. (E) The frequency of CD4+ and CD8+ MAIT cells expressing a TRM phenotype was compared in PBMC and BAL 4 wk after i.v. BCG vaccination in all 10 animals. (F) Expression of CD45RA, CCR7, CD69, and CD103 on iNKT cells is displayed after aggregating across all animals and performing dimensionality reduction with UMAP and scaling MFI as above. (G) Representative staining of CD45RA and CCR7 among CD8+ iNKT cells identified in one animal pre-BCG or 4 wk after i.v. BCG vaccination. (H) The frequency of CD4+ and CD8+ iNKT cells expressing a TEM phenotype was compared pre-BCG and at 4 wk after i.v. BCG vaccination. (I) Representative staining of CD69 and CD103 among CD8+ iNKT cells identified in PBMC and BAL at 4 wk after i.v. BCG vaccination. (J) The frequency of CD4+ and CD8+ iNKT cells expressing a TRM phenotype was compared pre-BCG and at 4 wk after i.v. BCG vaccination in all 10 animals. Results from line plots represent data from all animals. Statistical testing was performed using Wilcoxon signed-rank tests, and unadjusted p values are reported. The experiment was performed once. See also Supplemental Figs. 2 and 3.
