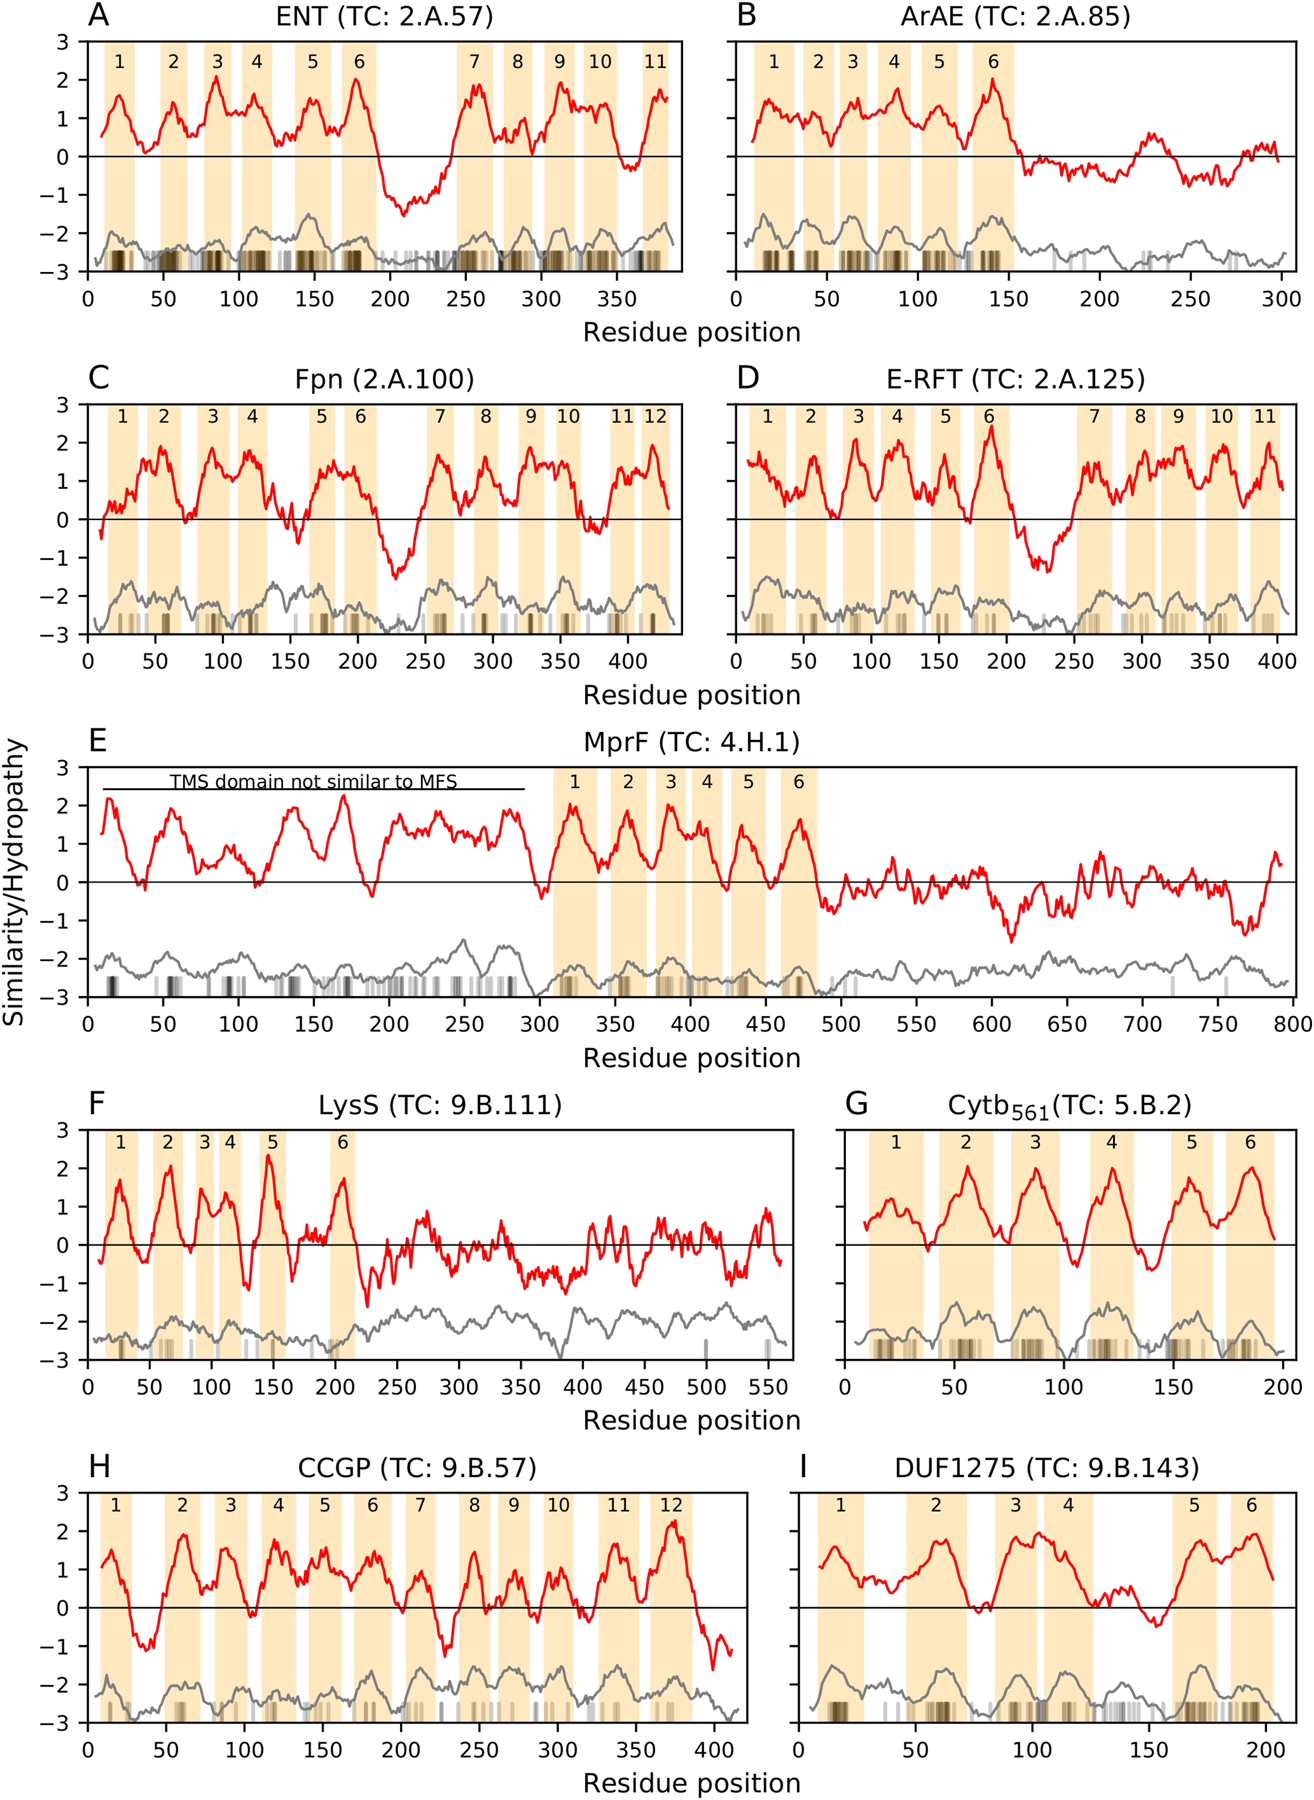
Fig 1. Average hydropathy plots of the 9 new families added to the MFS in this study.

The title of each panel indicates the corresponding family. Red curves indicate average hydropathy, gray curves indicate average similarity, and vertical thin black bars on the x-axis indicate residues predicted to be part of TMSs with HMMTOP. Hydrophobic peaks (i.e. inferred TMSs) are enumerated and highlighted with tan colored bars. Plots were generated with the AveHAS program [39] as described in Methods.
