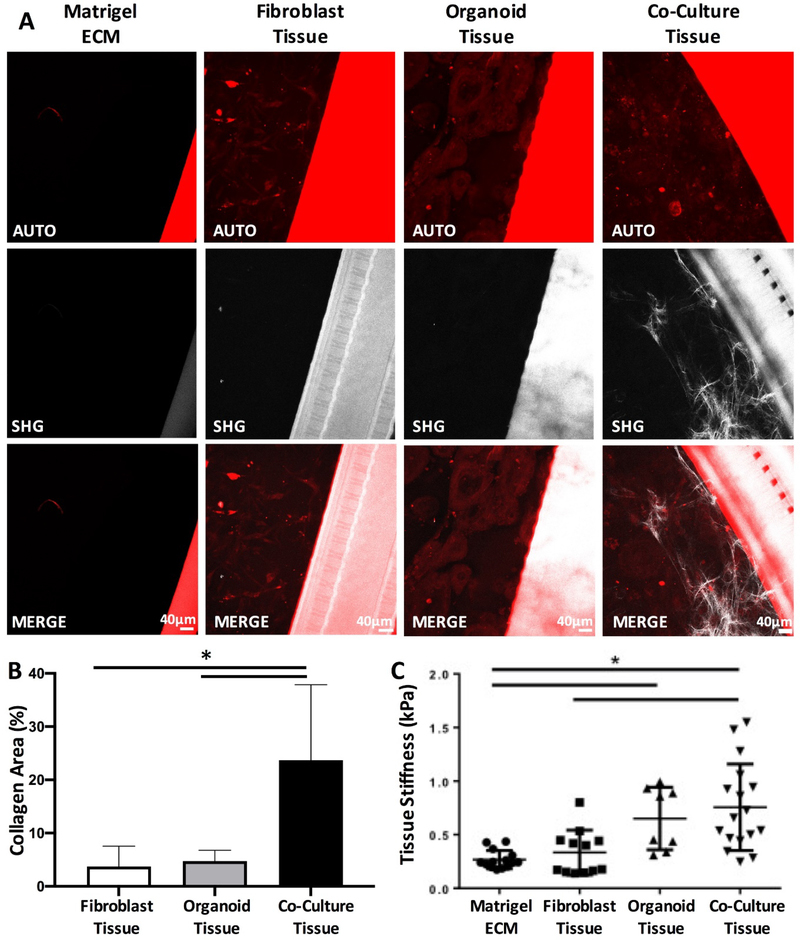
Figure 4: Co-culture of tumor organoids with fibroblasts potentiates pro-fibrotic changes in comparison to monoculture controls.
A) Representative second harmonic generation (SHG) images of the Matrigel extracellular matrix, fibroblast mono-culture tissue, organoid mono-culture tissue and organoid/FB co-culture tissues. Scale bar, 40μm. B) Quantification of collagen area in each of the tissues measured at day 8 from the second harmonic generation images (Data are mean ± SD, * p < 0.05, N = 3 tissues, z-stack of 2 different areas of each tissue were imaged, one-way ANOVA followed by Tukey’s comparison test) C) Tissue elasticity as determined by atomic force microscopy (Data are mean ± SD, * p < 0.05, N = 3 tissues, minimum of 3 spots of each tissue, one-way ANOVA, Tukey’s comparison test was used).

