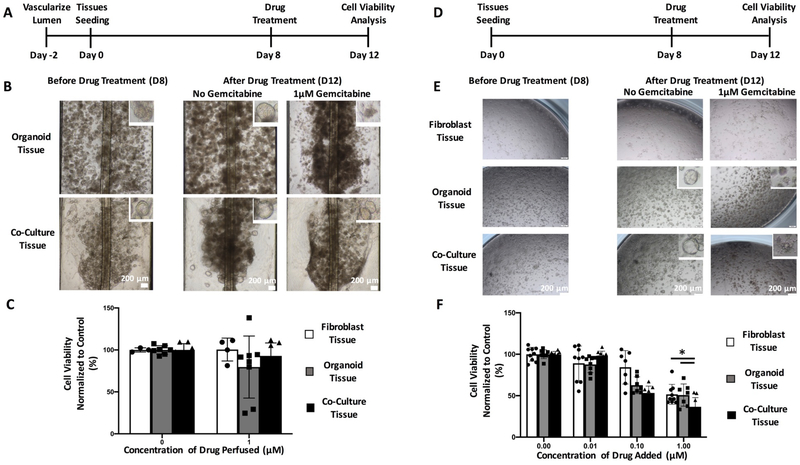
Figure 7: Vascularized fibroblast/organoid co-cultures exhibit reduced chemotherapy drug toxicity in comparison to static 96 well plates.
A) Timeline of seeding of vascularized organoid tissues on InVADE platform and the drug application. (B) Brightfield images of morphology of vascularized organoid tissues after four days of drug perfusion. Scale bar, 200μm. Insets depict morphological changes to individual organoids after drug treatment. (C) Cell viability as measured by CellTiter-Glo on perfused organoid cultures (Data are mean ± SD, N=7 tissues, tissues were generated from three separate seeding settings). (D) Timeline of seeding of organoid tissues in co-culture with fibroblasts in a Matrigel dome on a static 96 well plate. (E) Brightfield images of morphology of organoid tissues after four days of static drug treatment. Scale bar, 200μm. Insets depict morphological changes to individual of organoid after drug treatment. (F) Cell viability as measured by CellTiter-Glo on perfused organoid cultures (Data are mean ± SD, N = 9 tissues, tissues were generated from three separate seeding settings).

