Figure 2.
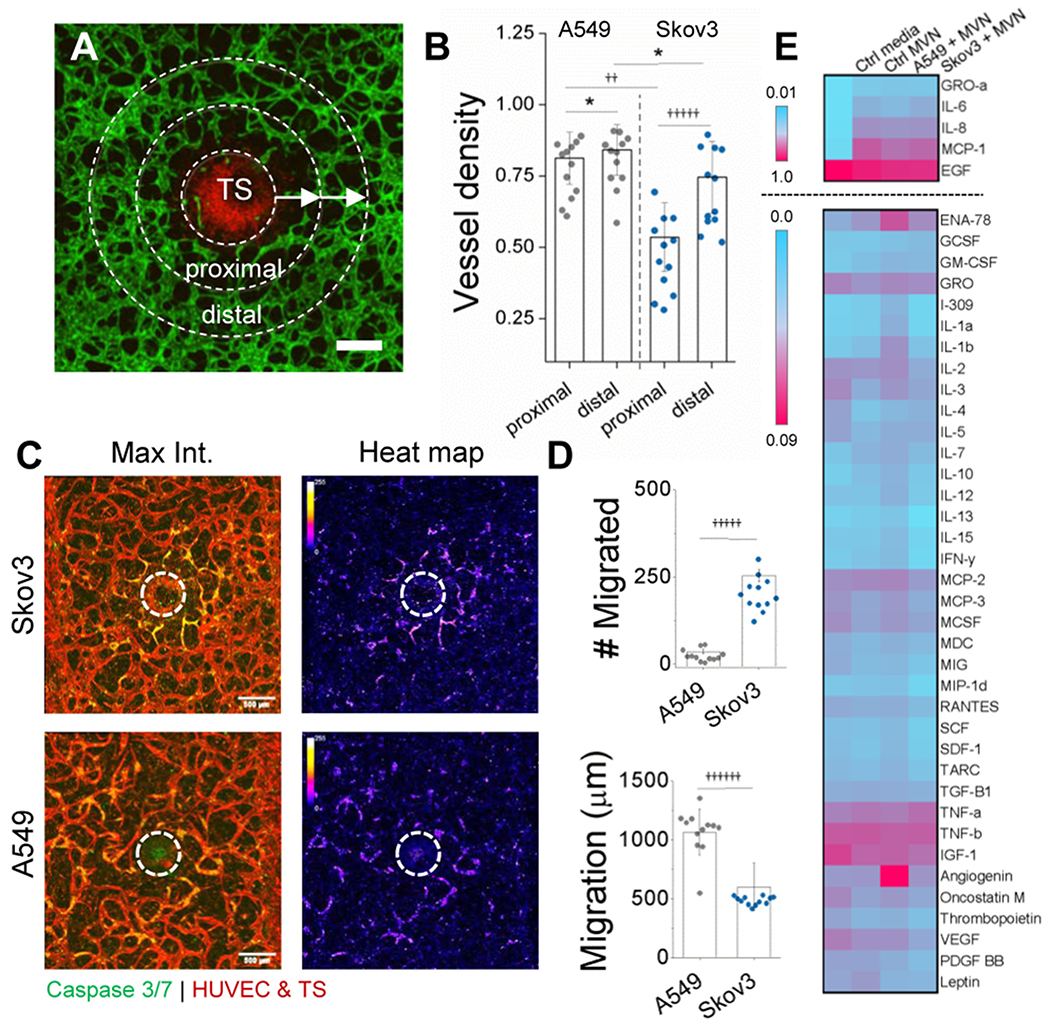
Tumor-associated changes are present in the vasculature as tumor cells infiltrate the TME. A) Confocal image demonstrating local changes in vessel density near the TS at day 7. HUVEC are green and Skov3 are red. Scale bar is 200 microns. B) Vessel density measured proximally and distally from the TS. Regions of interest are indicated in (A), where concentric regions of interest 150 microns from the outer TS were used to generate proximal and distal regions. C) Apoptosis is seen in the endothelium adjacent to the TS. Stitched, maximum projection confocal images (left) show highly local apoptosis in ECs adjacent to Skov3-TS. A549-TS results in more homogeneous distributions of EC apoptosis, more clearly demonstrated by heat maps (right). White dashed line indicates the TS. D) Cell migration in number (top) and distance (bottom), as measured from the TS exterior are shown for both Skov3 and A549. Single cell migration was measured at day 7 from stitched confocal images. E) A cytokine array is shown to qualitatively compare inflammatory cytokine expression between microvessels with and without tumor spheroids. Two scales are shown (normalized to highest expression levels) since the top 5 are much higher in signal than those shown separately below. Significance in (B) and (D) is *P<0.05, ††P<E−7, †††††P<E−11, ††††††P<E−12 using a t-test, as measured across 2 independent experiments with 6 samples each.

