Figure 4.
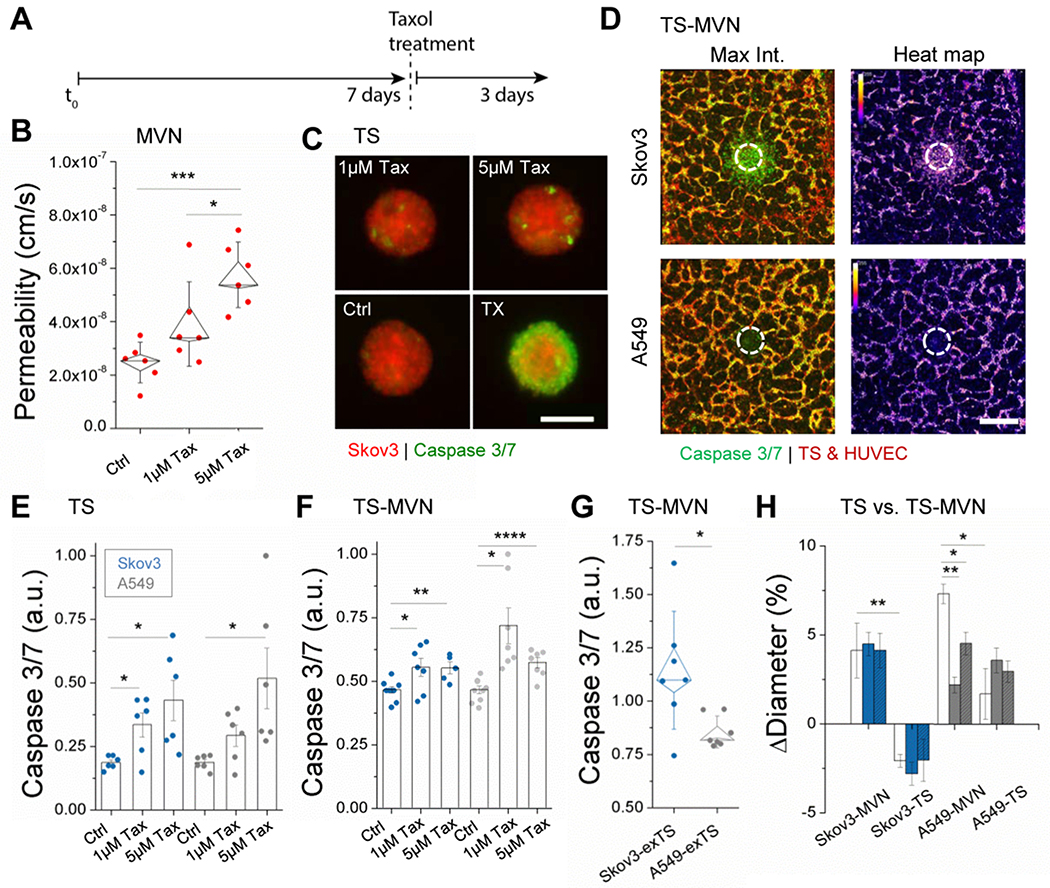
Taxol treatment affects the endothelium and tumor. A) Time-line for drug treatment. B) Permeability measurements to 40kDa dextran made in n=6 independent control MVN samples in response to drug treatment. Box plots are shown with outer bars as SD and inner limits of SEM overlaid over individual data points. C) Tumor spheroids are shown following Taxol treatment and incubation with a caspase 3/7 indicator. Triton-X (TX) was incubated with several spheroids to demonstrate increased apoptosis. D) Stitched confocal images demonstrate caspase 3/7 expression in the TS-MVN system 72hrs following treatment with 5μM Taxol. Corresponding heat maps (right) are shown. E) Increasing concentrations of Taxol result in increased apoptosis of Skov3 and A549 TSs, shown by normalized increases in caspase 3/7. Spheroids were treated directly in 96-well plates and imaged 72hrs later. F) Normalized caspase 3/7 intensity is shown for TS-MVN samples perfused and imaged at day 10 (72hrs after treatment). G) Integrated density measurements made in extra-tumoral region of interest. Intensities were normalized to the mean across each experiment. Shown are results from 3 separate experiments with n≥2 samples. H) Relative changes in tumor diameter were measured for TS-MVN and TSs alone at 24 (no color), 48 (color), and 72hrs (color + hashed lines) after treatment. For E-G) mean ± SEM is shown. Significance is indicated for t-tests, with *P<0.05, **P<0.01. ***P<0.001, and ****P<0.0001.

