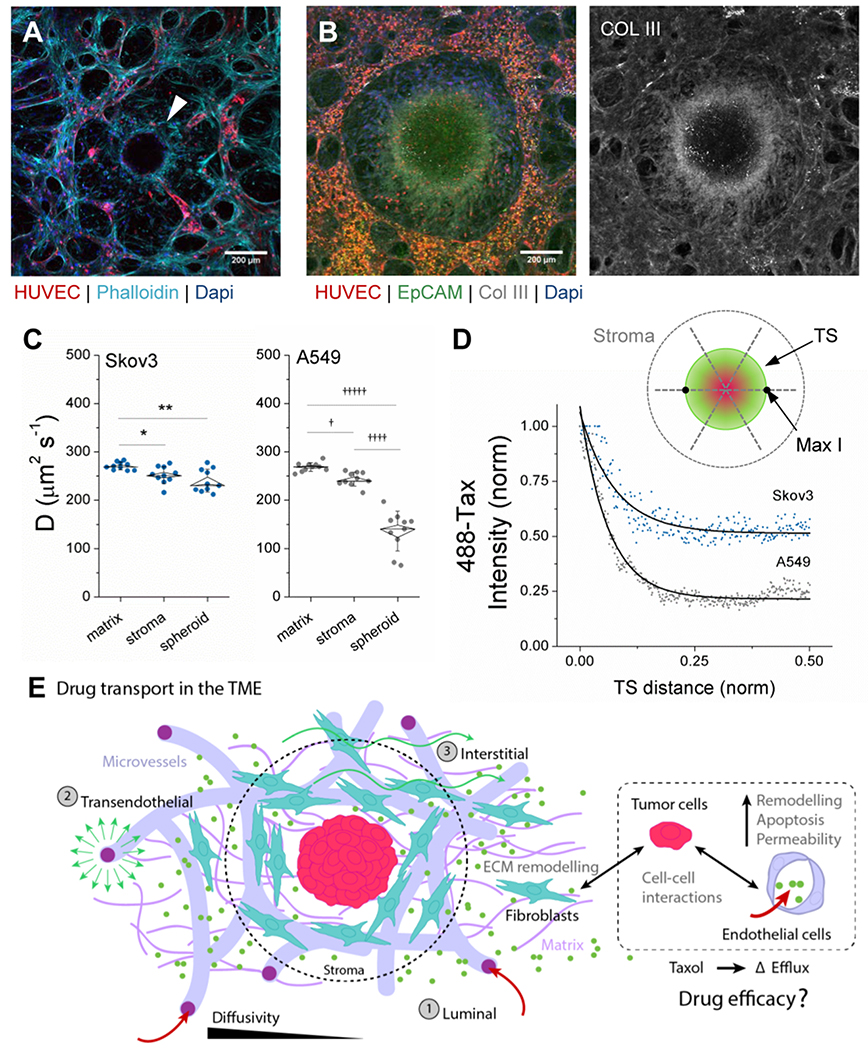
Figure 6.
Drug transport is affected by the tumor microenvironment. A) Fixed image of Skov3 (TS-MVN) at day 7 following co-culture. Mid-TS planar confocal image is shown demonstrating HUVEC-RFP and Skov3 (H2B-mcherry), and arrow indicating ring of fibroblasts (+Phalloidin, −RFP) surrounding TS. B) Max-projection image of A549 (TS-MVN) fixed at day 7 and stained for EpCAM and Collagen III (left). Right shows only Col III stain. C) Diffusivities measured in matrix, stroma, and within the TS at day 7 for both cancer cell lines (n=10 samples each). Shown are box-plots (inner SEM, outer bars SD) overlaid on individual samples. Significance is indicated for paired t-tests, with *P<0.05, **P<0.01, and †P<E−6, ††††P<E−10, †††††P<E−11. D) A representative (normalized) intensity of 488-Taxol accumulation within each TS – from outer TS to mid-point. The graph above demonstrates measurements made across the TS. E) A graphical summary of diffusive drug transport through the vasculature and TME, demonstrating the 3 transport routes in our model system. All co-cultured components dictate the efficacy of drug transport in the TS-MVN system.

