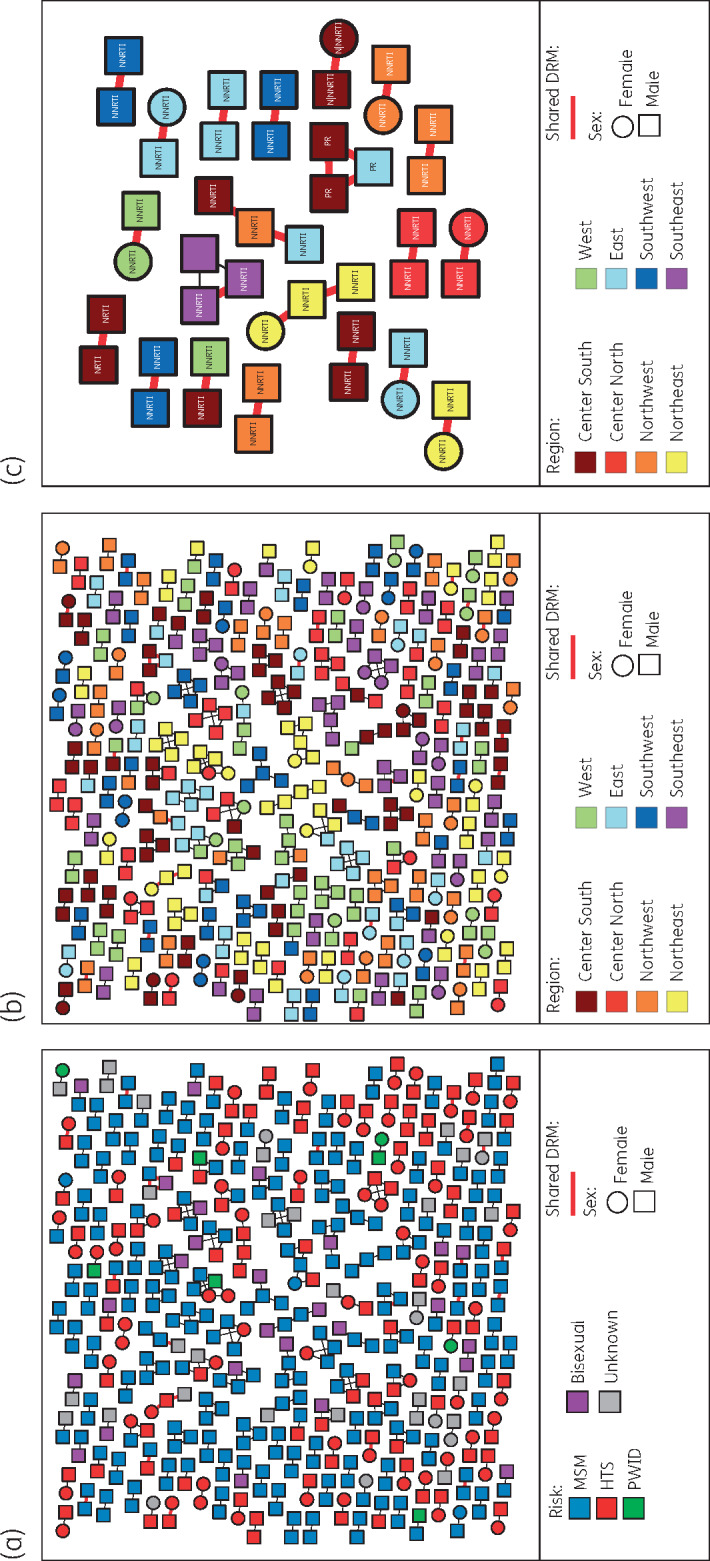
Figure 4.

HIV transmission network across Mexico. Nodes represent clustering sequences at a TN93 genetic distance threshold of <1.5%. Shape of nodes denotes gender. Nodes are coloured by (a) risk factor for HIV transmission; (b) and (c) geographical sub-region (see Figure S1). Only clusters of sequences that shared DRMs are shown in (c). Edges in bold red indicate sequences with shared DRMs. HTS, heterosexual; PWID, persons who inject drugs; DRM, drug resistance mutation. This figure appears in colour in the online version of JAC and in black and white in the printed version of JAC.
