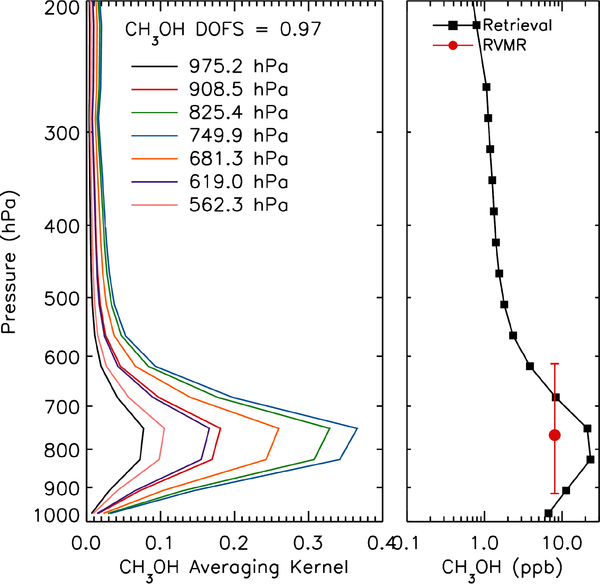
Fig. 6.
Averaging kernel (left) and retrieved methanol profile (right) from the TES spectrum in Fig. 5. The red circle shows the methanol Representative Volume Mixing Ratio (RVMR) and the red lines show the vertical extent over which the RVMR applies.

