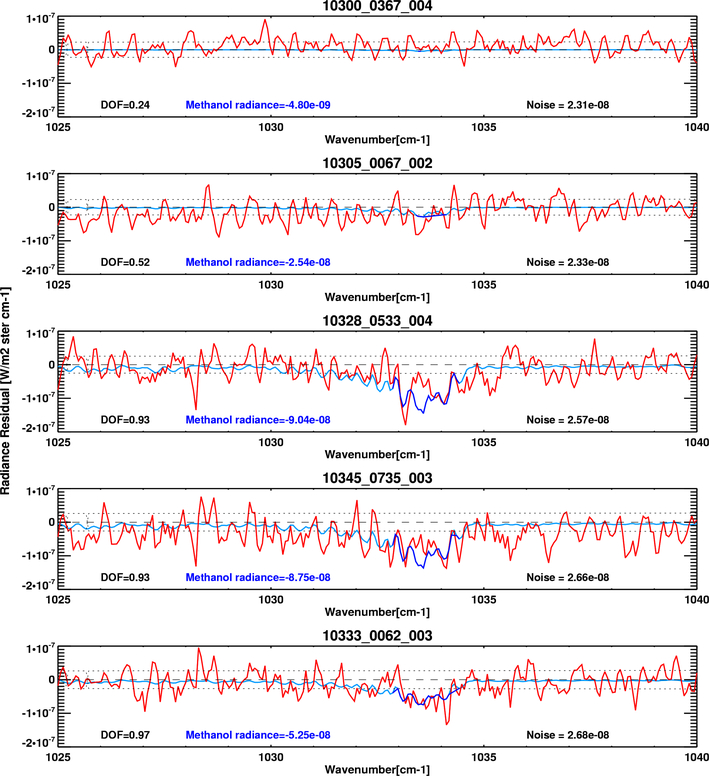
Fig. 8.
Methanol spectral signal in the TES observations. Shown are sample differences between measured TES spectra and forward model runs with no methanol (red curves), and the corresponding differences between forward model runs with retrieved methanol and no methanol (light blue curves). The methanol radiance is the mean of the latter over the spectral range highlighted in dark blue. The dotted lines indicate the expected noise level.

