Figure 4.

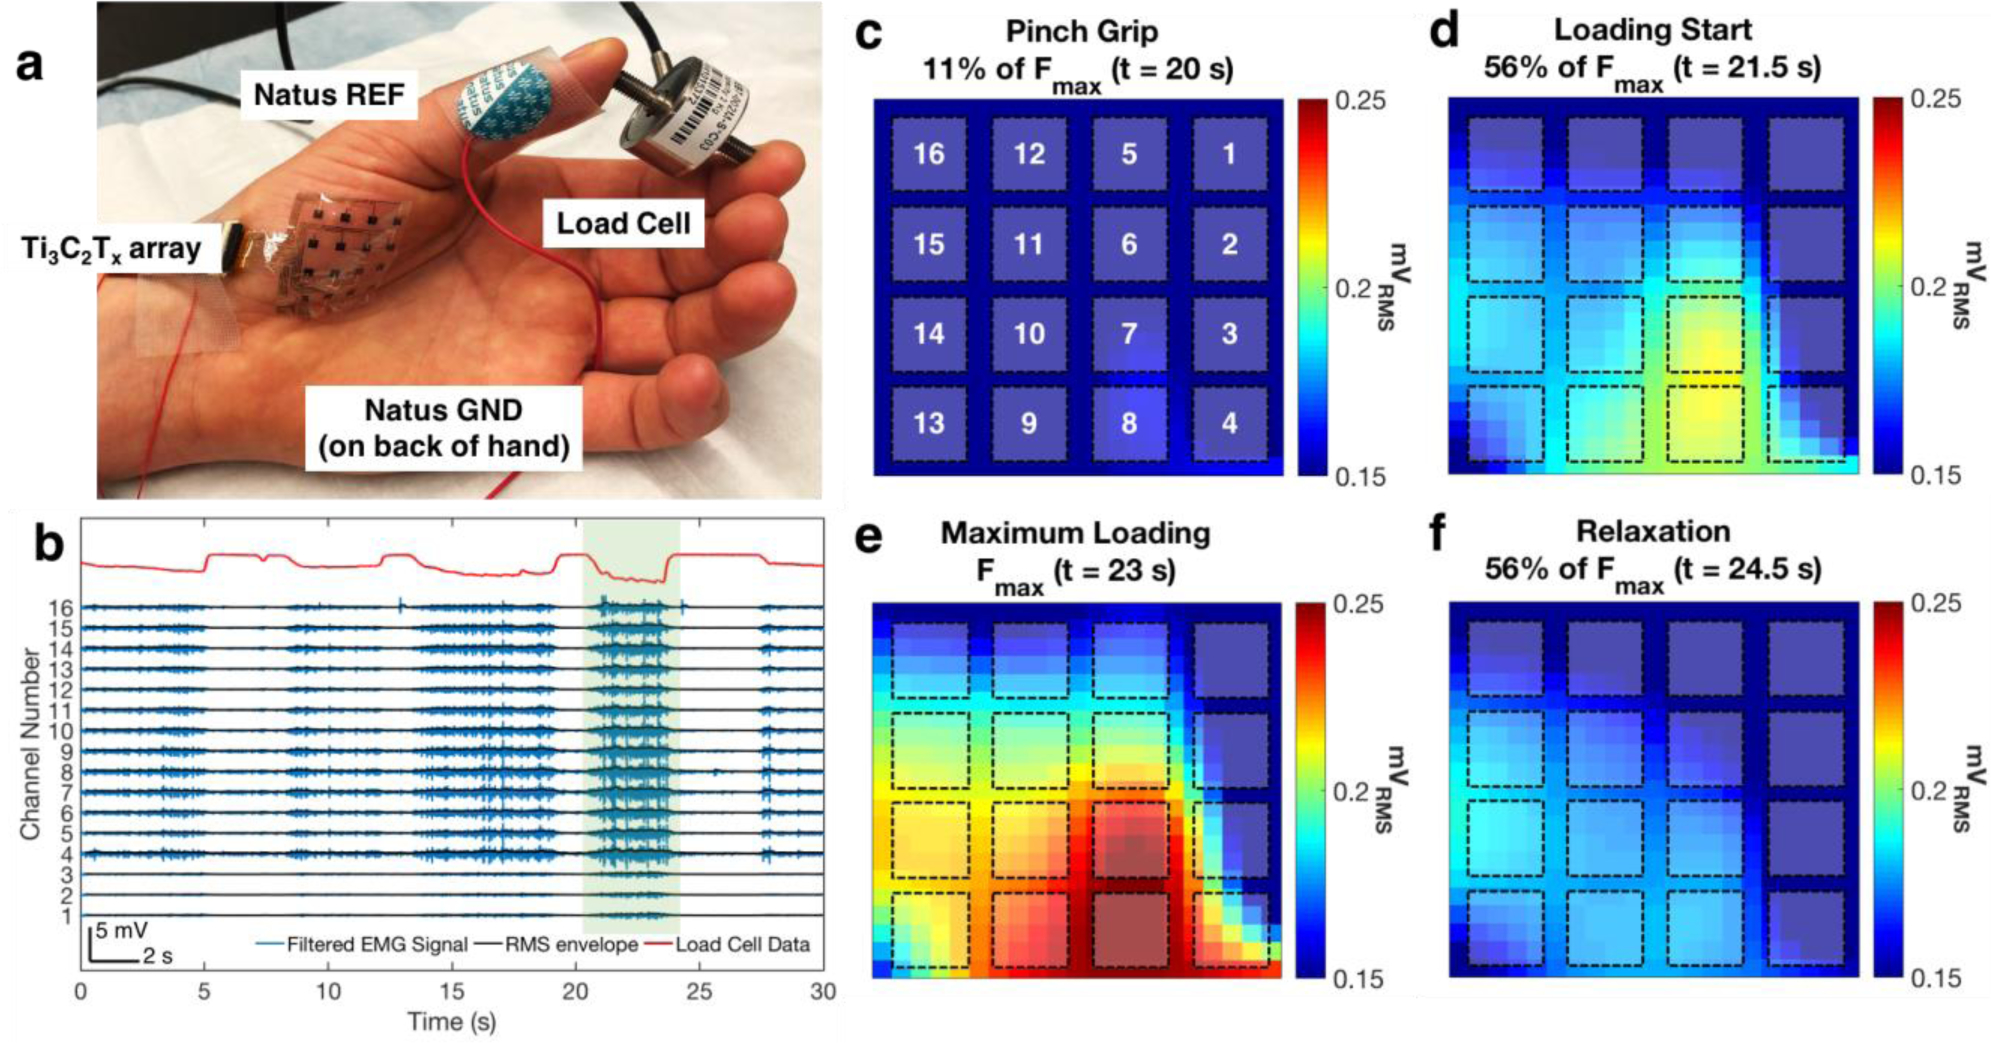
High-resolution mapping of muscle activation with the Ti3C2Tx HDsEMG array. a) Picture of the experimental setup. The Ti3C2Tx array is placed over the thenar eminence muscle group of the thumb, and the subject is asked to pinch a load cell between the thumb and forefinger at varying levels of exerted force. Reference and ground electrodes (Natus monopolar contacts) are placed on the head of the first metacarpal bone, and on the back of the hand, respectively. b) Example of HDsEMG and force data recorded during a load cell experiment. The top trace, in red, is the force intensity recorded at the load cell, while the traces in blue are the recorded sEMG for each channel in the Ti3C2Tx array. Approximately 5 loading epochs are shown in this recording. RMS envelopes are overlaid on the sEMG data, shown in black. c–f) RMS maps generated during the epoch highlighted in green in (b). RMS maps were generated during the c) pinch grip, d) loading start, e) maximum loading, and f) relaxation phases of the task. Locations of the channels of the Ti3C2Tx array are overlaid on top of the RMS maps, with the channel numbering shown in (c).
