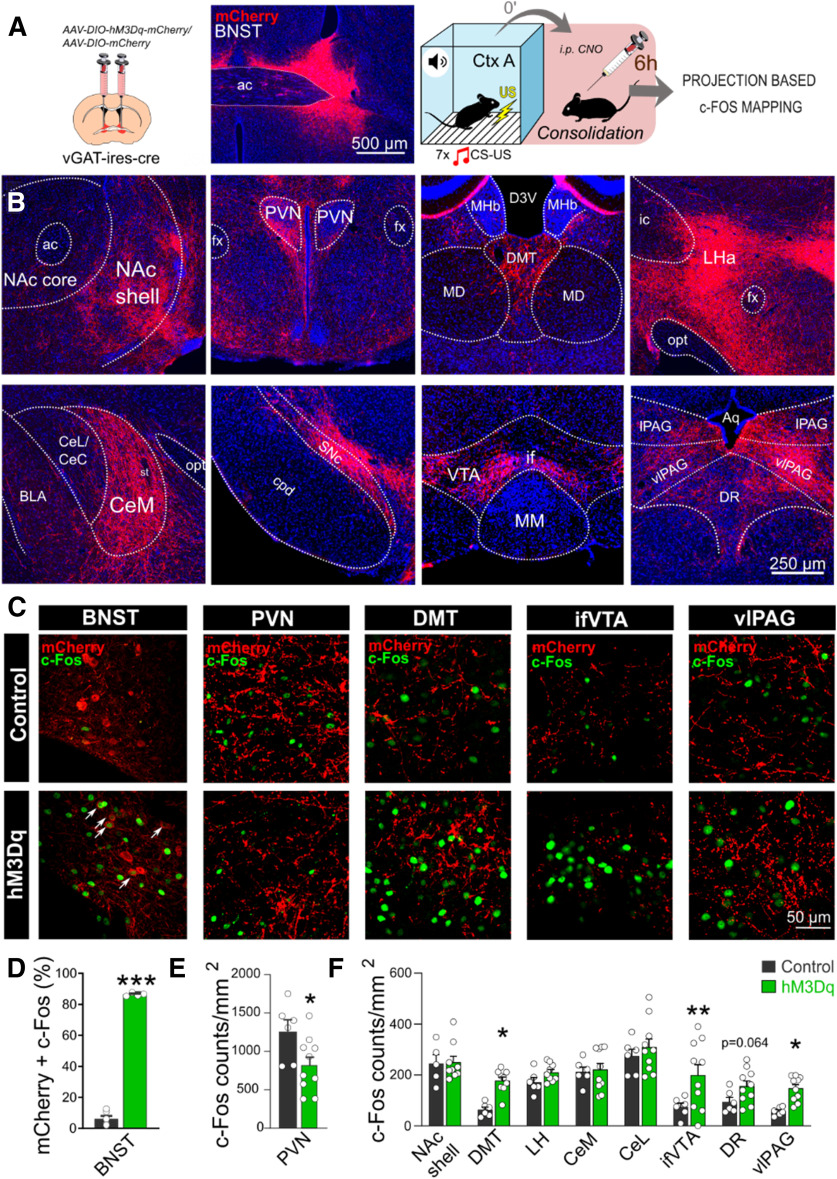
Figure 3.
Postsynaptic activity following chemogenetic stimulation of the BNST during memory consolidation. A, Schematics of virus injections and representative photomicrograph of mCherry expression in the BNST. Right panel shows experimental design: c-Fos expression was assesses 6 h after fear conditioning combined with subsequent chemogenetic activation (i.e., in the consolidation phase). B, Representative wide-field fluorescence photomicrographs depicting major projection areas of BNSTvGAT neurons. C, Representative single-plane confocal photomicrographs showing altered c-Fos expression during consolidation in the BNST and downstream regions, where white arrows indicate activated hM3Dq-expressing BNSTvGAT neurons (mCherry+c-Fos). D, C-Fos activity was significantly increased in the BNST, and DMT, vlPAG, ifVTA downstream regions (F), with additional decrease in PVN (E). ac, anterior commissure; amBNST, anteromedial BNST; Aq, cerebral aqueduct; BLA, basolateral amygdala; CeL/CeC, central amygdala, lateral/capsular part; CeM, central amygdala, medial part; cpd, cerebral peduncle; D3V, dorsal part of the third ventricle; DMT, dorsal midline thalamus; DR, dorsal raphe; fx, fornix; ic, internal capsule; LHA, lateral hypothalamic area; MD, mediodorsal thalamus; MHb, medial habenula; MM, medial mammillary nucleus; NAc, nucleus accumbens; opt, optic tract; PVN, paraventricular hypothalamic nucleus; SNc, substantia nigra, pars compacta; st, stria terminalis; vlPAG/lPAG, periaqueductal gray, ventrolateral/lateral part; ifVTA, ventral tegmental area, interfascicular nucleus. Asterisks represent main effect of one-way ANOVA: *p < 0.05, **p < 0.01, ***p < 0.001.

