Figure 2.
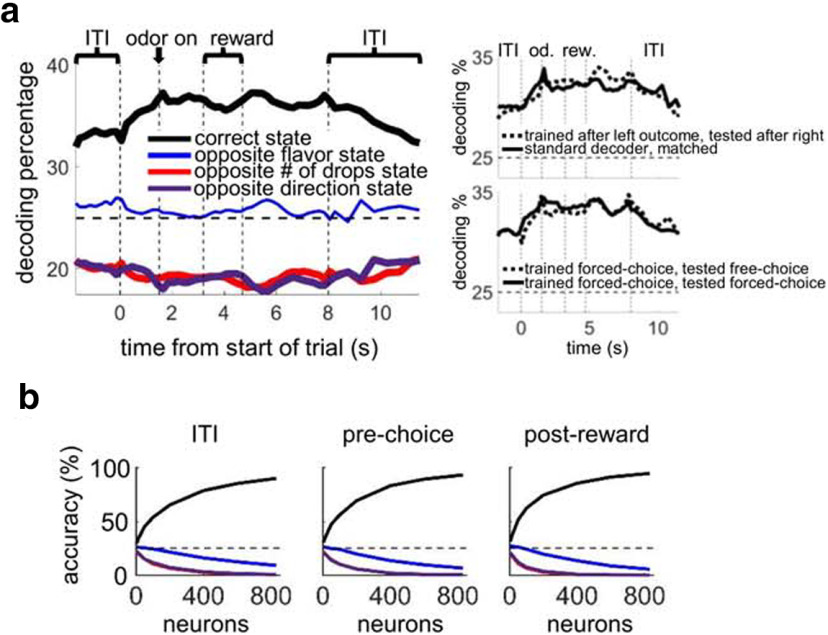
OFC pseudo-ensembles decode the current state accurately across all parts of trials. a, Left, Black line indicates the percentage of trials classified to the correct state, using a 25 neuron pseudo-ensemble and a sliding 500 ms epoch aligned to different trial events and concatenated (the end of the ITI indicates the time the house light was turned on). Other lines indicate misclassification to the other possible states: blue represents the state with opposite flavor but the same number of drops (at both wells) as the correct state; red represents the state with the opposite number of drops but same flavor (at both wells) as the correct state; purple represents the state with the same two outcomes as the correct state, but at the opposite wells. Thick lines indicate significant difference from chance using a bootstrap distribution with shuffled labels (p < 0.01 for at least 5 consecutive bins). All rewarded trials were included in the decoder. Smaller panels on right of a represent two control analyses: Top, Training on trials immediately after outcome at left well, testing on trials immediately after outcome at right well. This shows that state representations do not reflect memory traces of the outcome delivered on the previous trial. Bottom, Training on forced-choice and testing on free-choice trials, showing that state representations generalize across trial type. Significant differences in control analyses were assessed at p < 0.01 by comparing decoding percentages as a function of ensembles sizes as described in Materials and Methods (nonsignificant for both). b, State-decoding accuracy as a function of ensemble size using three 1000 ms epochs, with misclassification shown as in a. Across all epochs, decoding accuracy approached 100%, with states differing only in the flavor of outcomes being the most likely to be misclassified. Dotted lines in all plots indicate chance level of accuracy (25%).

