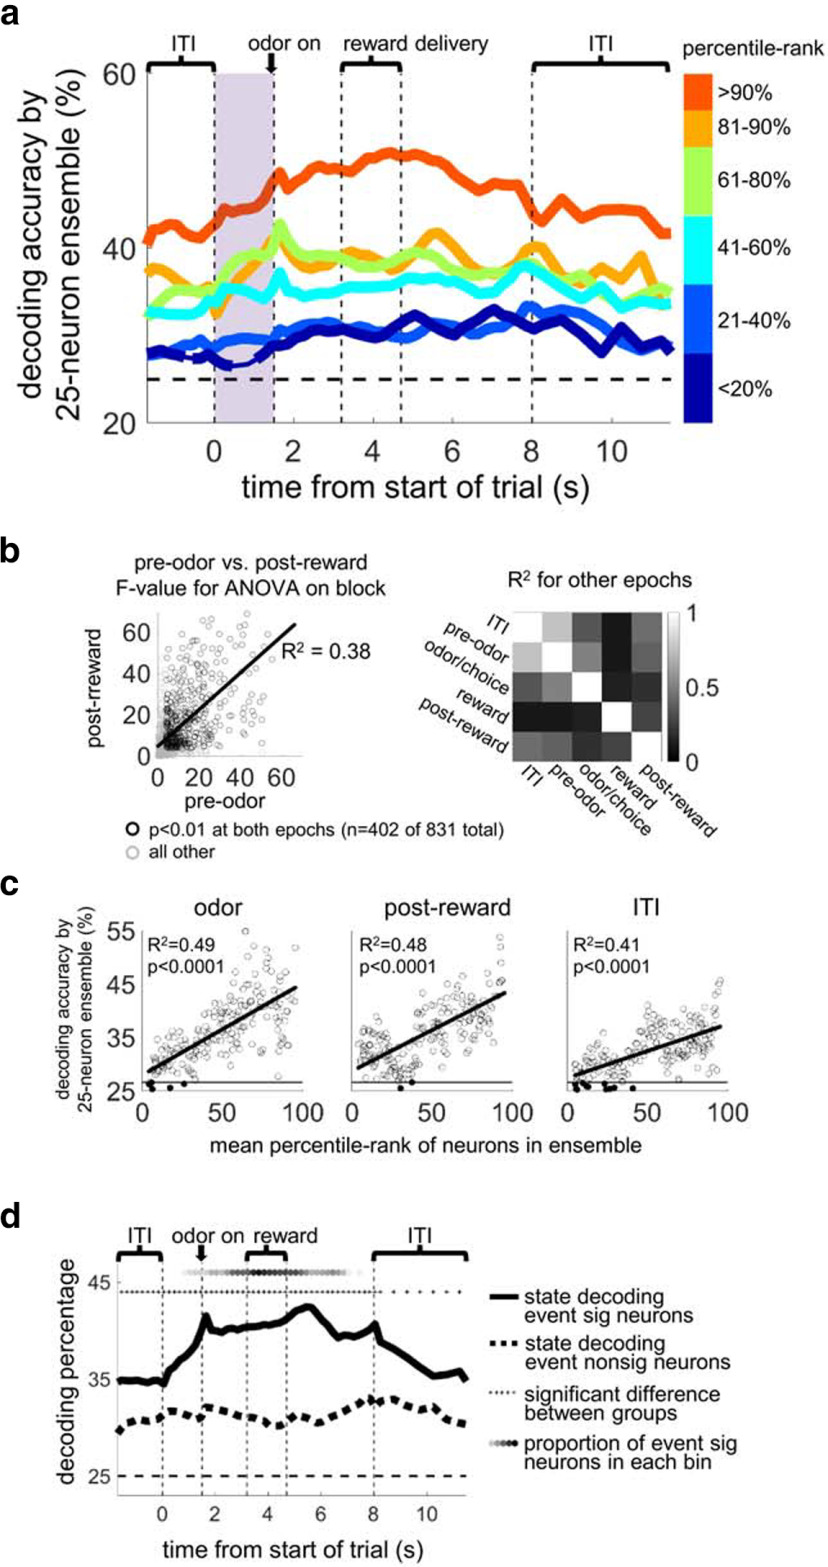
Figure 3.
Individual OFC units maintain information about state across the trial, and state information is widely distributed across the OFC population. a, The average accuracy of block decoding of 25 neuron OFC ensembles taken from ranked subpopulations. Neurons were ranked by the F values from an ANOVA using factor “state” run on each neuron's firing rate during the preodor period (shaded in purple). Ensembles from across the entire OFC population decoded state above chance across the whole trial, although they were ranked using firing rate only in the preodor epoch. Thick lines indicate significance versus chance at p < 0.01 by bootstrap for at least five consecutive bins. This suggests that individual units tended to maintain state information across the whole trial and that the majority of OFC neurons contributed to the state information observed in ensembles. b, Scatter plot represents the correlation between the F values for block ANOVAs run on the prechoice epoch versus the postreward epoch across all OFC neurons. b, Right, R2 values for other pairs of epochs. c, The linear correlation between mean percentile rank of the neurons in 200 25 neuron ensembles randomly selected from a segment of 10% of all the neurons sliding across the population from the top-ranked to the bottom-ranked neurons, versus their state-decoding accuracy for three 500 ms epochs across the trial. Horizontal line indicates the significance level for decoding accuracy at p < 0.001. Filled circles represent ensembles below the significance line, of which there were 9 of 200 for the odor epoch, 3 of 200 for the postreward epoch, and 14 of 200 for the ITI epoch. d, Lines indicate state-decoding by 25 neuron ensembles selected from event-significant neurons (defined by ANOVA for factors odor, direction, or outcome in any bin) versus event-nonsignificant neurons. Both groups decoded state better than chance and were significantly different from each other across all bins. Top, Shaded circles represent proportion of neurons significant for event ANOVAs in each bin, ranging from 0% (white) to 10% (black) of all possible significance tests across all neurons.

