Figure 2.
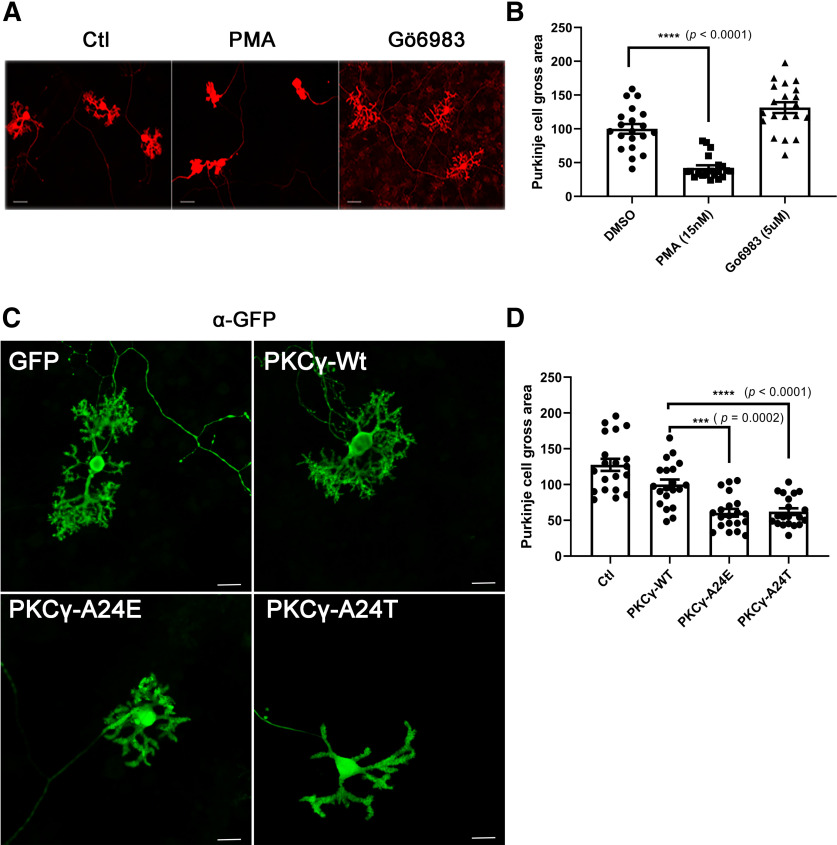
Immunofluorescence staining of Purkinje cells transfected with PKCγ pseudosubstrate domain mutants. A, The morphology of Purkinje cells was analyzed after 2 weeks in dissociated cerebellar culture. Purkinje cells treated with 15 nm PMA for 1 week show small dendrites. Scale bar, 50 µm. B, Differences between control and PMA-treated Purkinje cell size were analyzed using the two-tailed Mann–Whitney test (Wt + DMSO = 100.0% ± 7.15; Wt + PMA = 42.21% ± 3.92; Wt + Gö6983 = 131.5% ± 7.98; for DMSO vs PMA, p < 0.0001). Data are mean ± SEM of 20 Purkinje cells. C, Purkinje cells transfected with pseudosubstrate domain mutations show inhibition of dendritic growth with anti-GFP staining. Scale bar, 20 µm. Images were acquired with a confocal microscope (Carl Zeiss, LSM710) equipped with solid state lasers using a LD Plan-Neofluar objective (Carl Zeiss). D, Quantification of the Purkinje cell area. The dendritic tree size of Purkinje transfected with PKCγ pseudosubstrate domain mutations GFP-PKCγ-A24E or GFP-PKCγ-A24T was strongly reduced compared with that of GFP-PKCγ-Wt (GFP-PKCγ-Wt = 100.0% ± 6.92; GFP-PKCγ-A24E = 62.16% ± 4.68; GFP-PKCγ-A24T = 60.53% ± 5.35). Each Purkinje cell area was measured with ImageJ and analyzed with GraphPad Prism. Differences between GFP-PKCγ-Wt and GFP-PKCγ-A24E or GFP-PKCγ-Wt and GFP-PKCγ-A24T were analyzed using the two-tailed Mann–Whitney test (GFP-PKCγ-A24E, p = 0.0002 and GFP-PKCγ-A24T, p < 0.0001). Data are mean ± SEM of 20 Purkinje cells.

