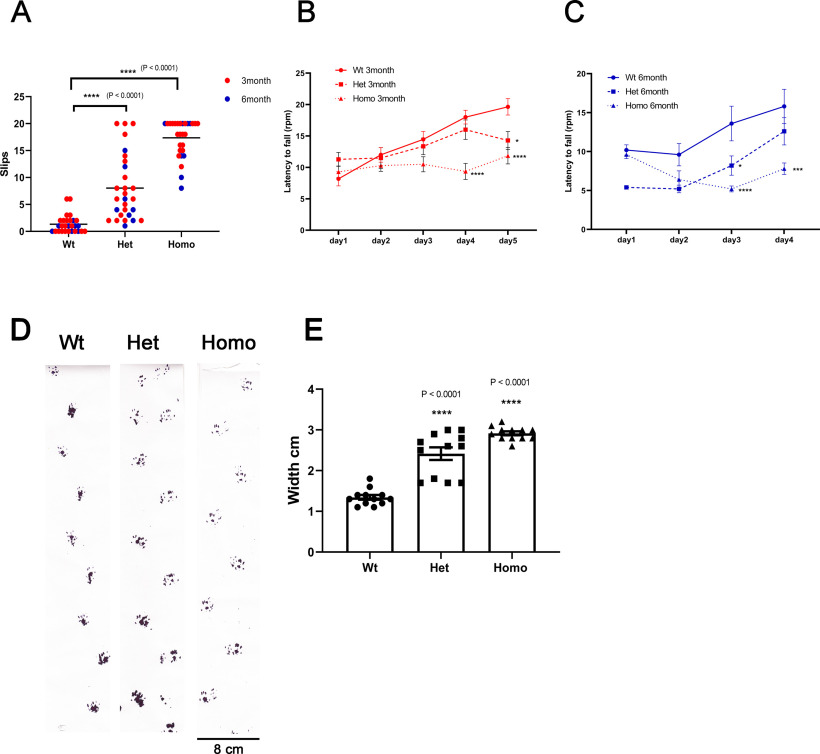
Figure 7.
Behavior analysis shows motor deficit and ataxic phenotype in PKCγ-A24E mice. A, The beam test was done in 3- and 6-month-old mice. Slip count of Wt (1.235 ± 0.271, n = 28), Het (9.265 ± 1.079, n = 28, p < 0.0001), and Homo PKCγ-A24E mice (17.50 ± 0.056, n = 28, p < 0.0001). Data are mean ± SEM. Statistical significance of the values of Wt and PKCγ-A24E mice groups was analyzed by two-way ANOVA test with Bonferroni correction: ****p < 0.0001. B, C, Rotarod performance test was evaluated in 3-month-old mice (B) and 6-month-old mice (C). B, Latency to fall on day 4: Wt = 17.00 ± 2.000 rpm, n = 11; Het = 18.00 ± 1.528 rpm, n = 14; Homo = 4.333 ± 1.212 rpm, p < 0.0001, n = 14 and on day 5: Wt = 24.33 ± 1.202 rpm, n = 11; Het = 14.67 ± 1.202 rpm, p = 0.0317, n = 14; Homo = 6.67 ± 0.667 rpm, p < 0.0001, n = 14. C, Latency to fall on day 3: Wt = 13.60 ± 2.227 rpm; Het = 8.200 ± 1.241 rpm, p = 0.0127; Homo = 5.200 ± 0.374 rpm, p < 0.0001; n = 5 for each genotype and on day 4: Wt = 15.80 ± 2.200 rpm; Het = 12.60 ± 1.749 rpm; Homo = 7.80 ± 0.735 rpm, p = 0.0002; n = 5 for each genotype. Data are mean ± SEM. Statistical significance of the values of Wt and PKCγ-A24E mice groups was analyzed by two-way ANOVA test with Bonferroni correction: *p < 0.05; ***p < 0.001; ****p < 0.0001. D, Footprints of 9-month-old Wt and PKCγ-A24E mice were evaluated for step width. E, Wt = 1.30 ± 0.058 cm, n = 12; Het = 2.60 ± 0.154 cm, n = 12; Homo = 2.95 ± 0.047 cm, n = 12. Data are mean ± SEM. Statistical significance of the values of Wt and Het or Homo PKCγ-A24E mice groups was analyzed by two-way ANOVA test with Bonferroni correction: ****p < 0.0001.

