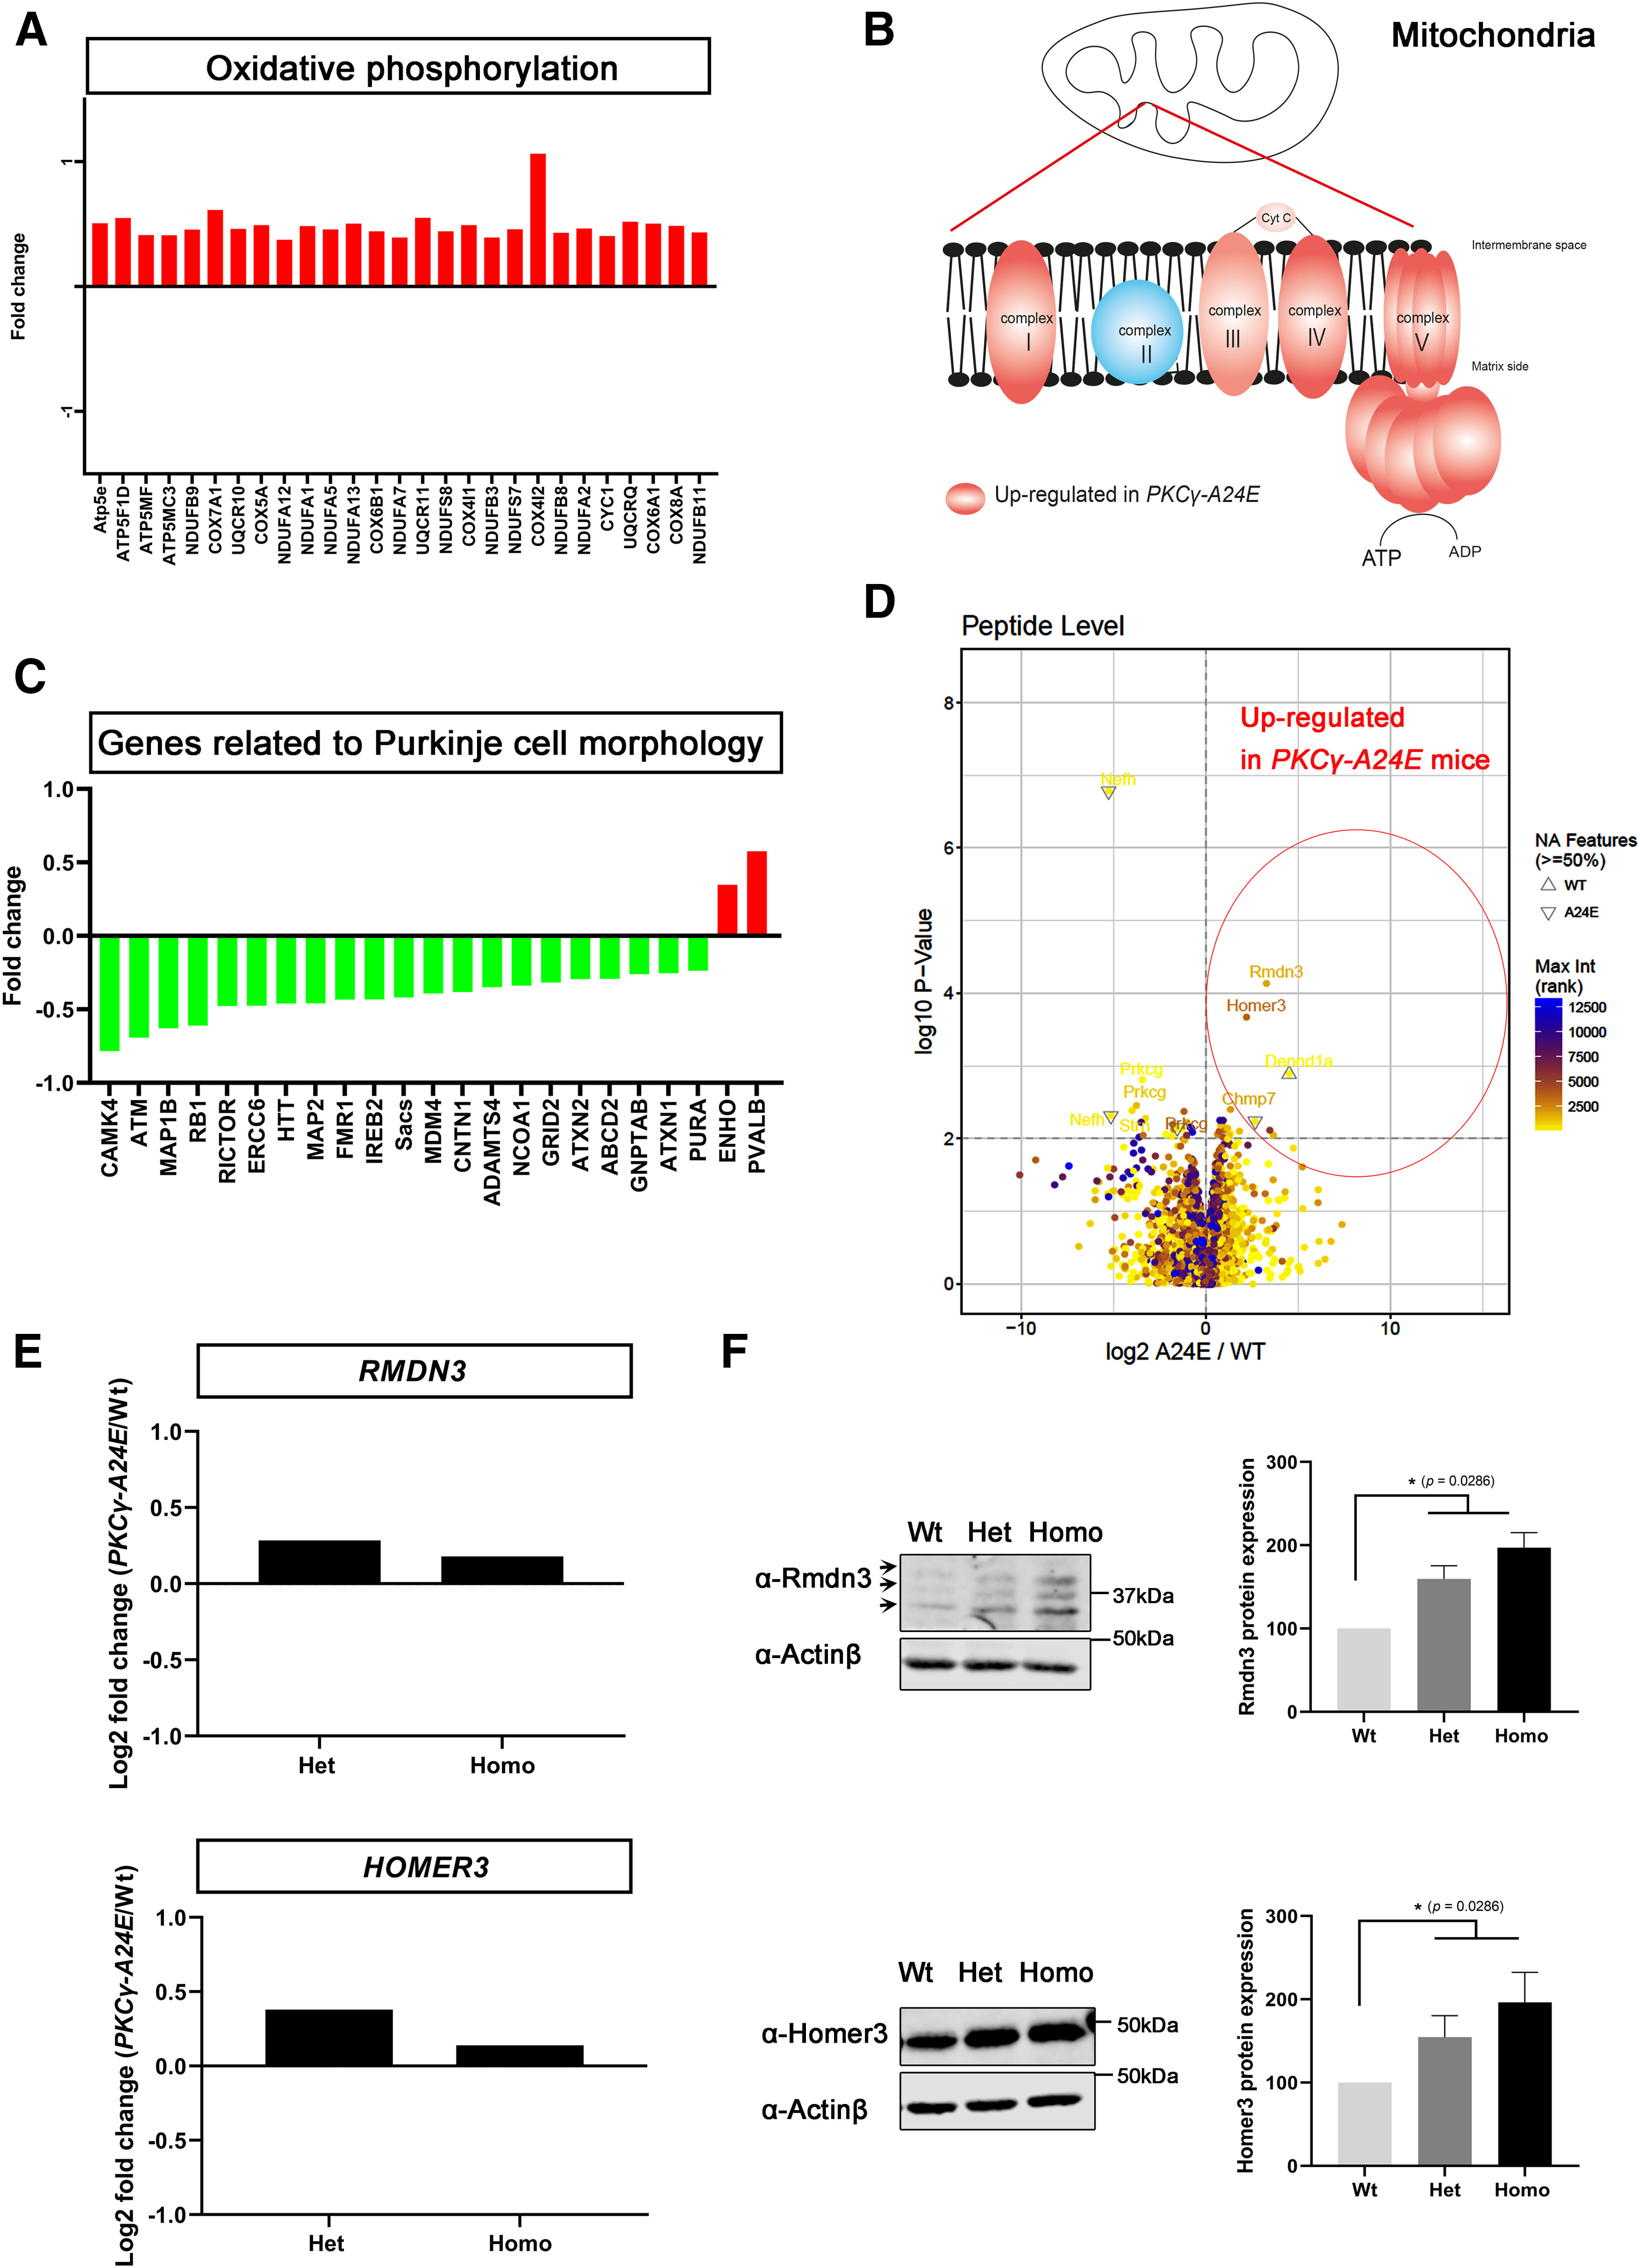
Figure 8.

RNA sequence analysis and phosphoproteomics analysis. A, B, Many oxidative phosphorylation-related genes in Complex I, Complex III, Complex IV, and Chemiosmosis are upregulated in Het PKCγ-A24E mice in RNA sequencing. A, IPA showed that many ubiquinone oxidoreductase subunits and cytochrome c oxidase subunits are significantly upregulated in Het PKCγ-A24E mice. y axis is log2 fold change. B, Red complexes are upregulated in Het PKCγ-A24E mice, which locate in the mitochondrial membrane. C, Network analysis was performed by IPA of gene sets upregulated or downregulated in Het PKCγ-A24E mice compared with Wt littermates. Green genes represent decreases. Red genes represent increases. Many genes related to Purkinje cell morphology are downregulated in Het PKCγ-A24E mice. D, Volcano plot of phospho-proteomics analysis of Wt versus Homo PKCγ-A24E mice (n = 3). Lysates from 7-week-old Wt and PKCγ-A24E mice were subjected to phosphoproteomic analysis by mass spectrometry. Differentially enriched phosphopeptides are shown in the volcano plot. x axis is log2 fold change, and y axis is p value. Rmdn3 and Homer3 are among the proteins with a significantly increased phosphorylation in PKCγ-A24E mice. E, RNA sequence data show that Rmdn3 and Homer3 are upregulated in PKCγ-A24E mice. F, Western blot analysis of Rmdn3 and Homer3 from organotypic slice cultures. Homer3 protein expression (Wt = 100.0%, n = 4; Het = 149.7%, p = 0.0286, n = 4; Homo = 184.2%, p = 0.0286, n = 4) and Rnmd3 protein expression (Wt = 100.0%, n = 4; Het = 167.0%, p = 0.0286, n = 4; Homo = 206.5%, p = 0.0286, n = 4) are increased in PKCγ-A24E mice. Statistical analysis using the two-tailed Mann–Whitney test showing increased protein expression in PKCγ-A24E mice.
