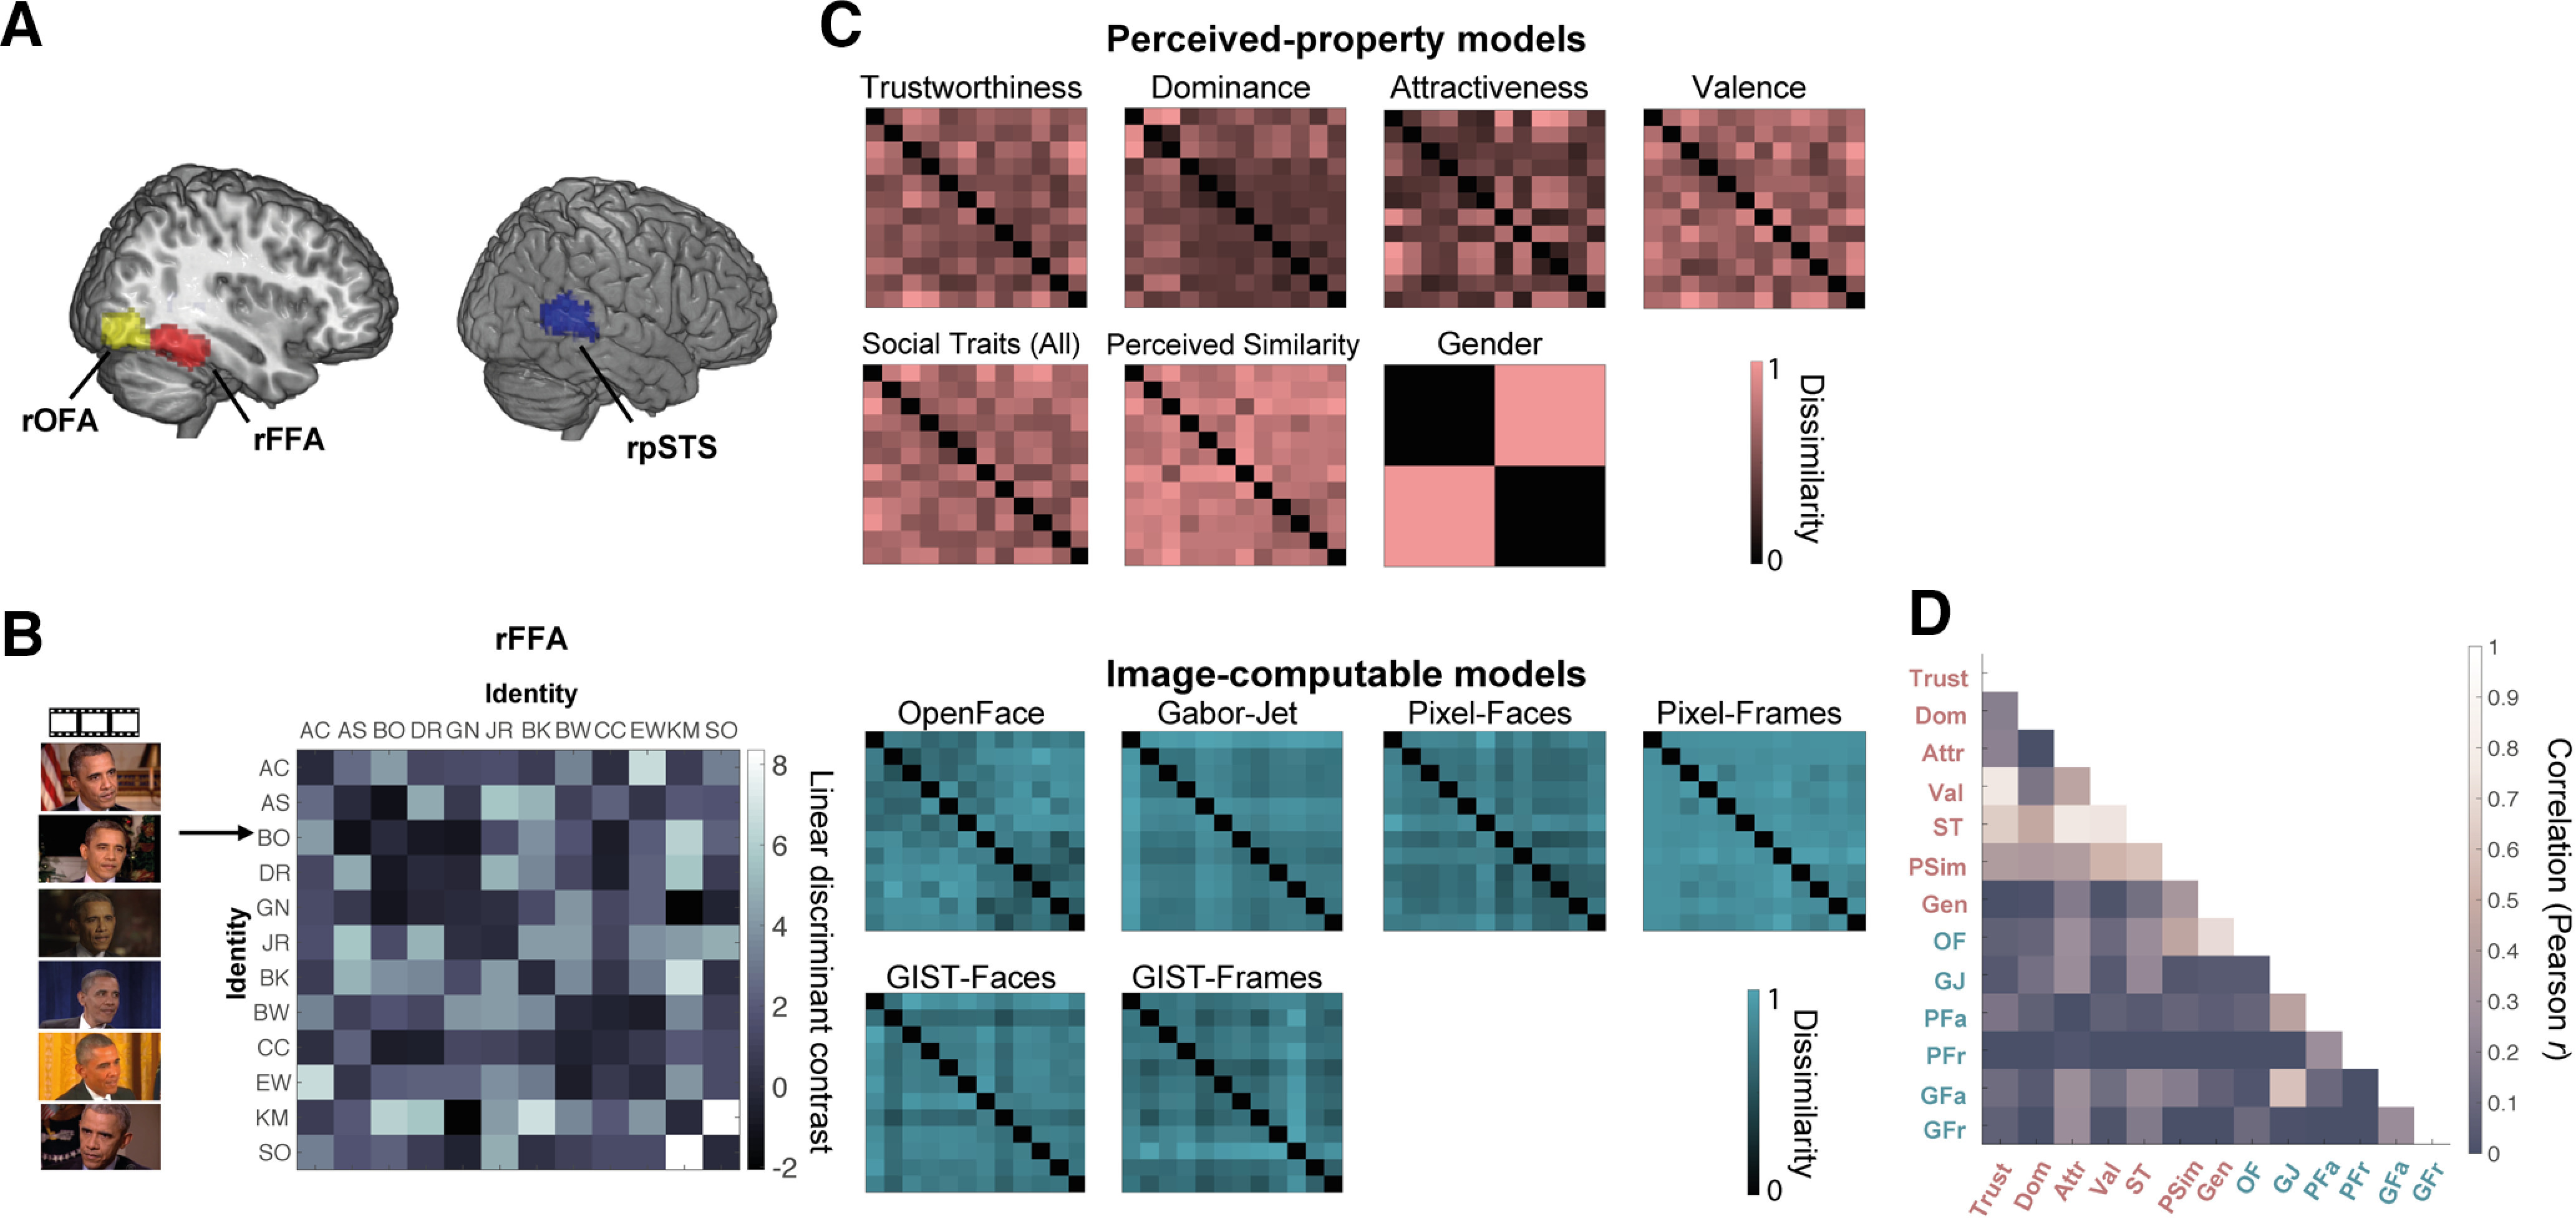
Figure 2.

Brain and model representational dissimilarity matrices (RDMs). A, Location in MNI space of the three face-selective regions localized in our participants: rOFA, rFFA, and rpSTS (all regions in the right hemisphere). These probabilistic maps were created for illustration purposes (in our analyses, we only used subject-specific ROIs) and show all voxels that were present in at least 20% of participants. B, Example brain RDM for the rFFA. For each ROI and each participant, we computed RDMs showing the dissimilarity of the brain response patterns between all pairs of identities. Each row and column represent one identity, and response patterns are based on all six presented videos of that identity. Each cell represents the LDC distance between the response patterns of two identities (higher values indicate higher dissimilarity), cross-validated across runs presenting different videos of the face of each identity. The matrix is symmetric around a diagonal of zeros. C, Model RDMs for Image-computable properties (blue) and Perceived properties (pink). These models are in the same format as the brain RDMs and show the dissimilarity between two identities on each property (see Materials and Methods). Image-computable models include a neural network trained to distinguish between face identities (OpenFace), a Gabor-Jet model, Pixel Dissimilarity (both for faces only, Pixel-Faces; and the whole frames, Pixel-Frames), and a GIST Descriptor model (both for faces, GIST-Faces; and the whole frames, GIST-Frames). The RDMs computed per image (before averaging across identity) are shown in Extended Data Figure 2-1, although those 72 × 72 RDMs were not used in any analysis. Perceived-property models include perceived social traits [Trustworthiness, Dominance, Attractiveness, Valence, Social Traits (All)], Perceived Similarity, and Gender. Models based on participant ratings were averaged across participants. All models were built based on multiple images (Image-computable models) or videos (Perceived-property models) of the face of each identity. For visualization purposes, all model RDMs were scaled to a range between 0 (no dissimilarity) and 1 (maximum dissimilarity). D, Correlations (Pearson) between the different model RDMs. The different candidate models were compared with each other using Pearson correlation. Extended Data Figure 2-2 shows this same matrix with added correlation values.
