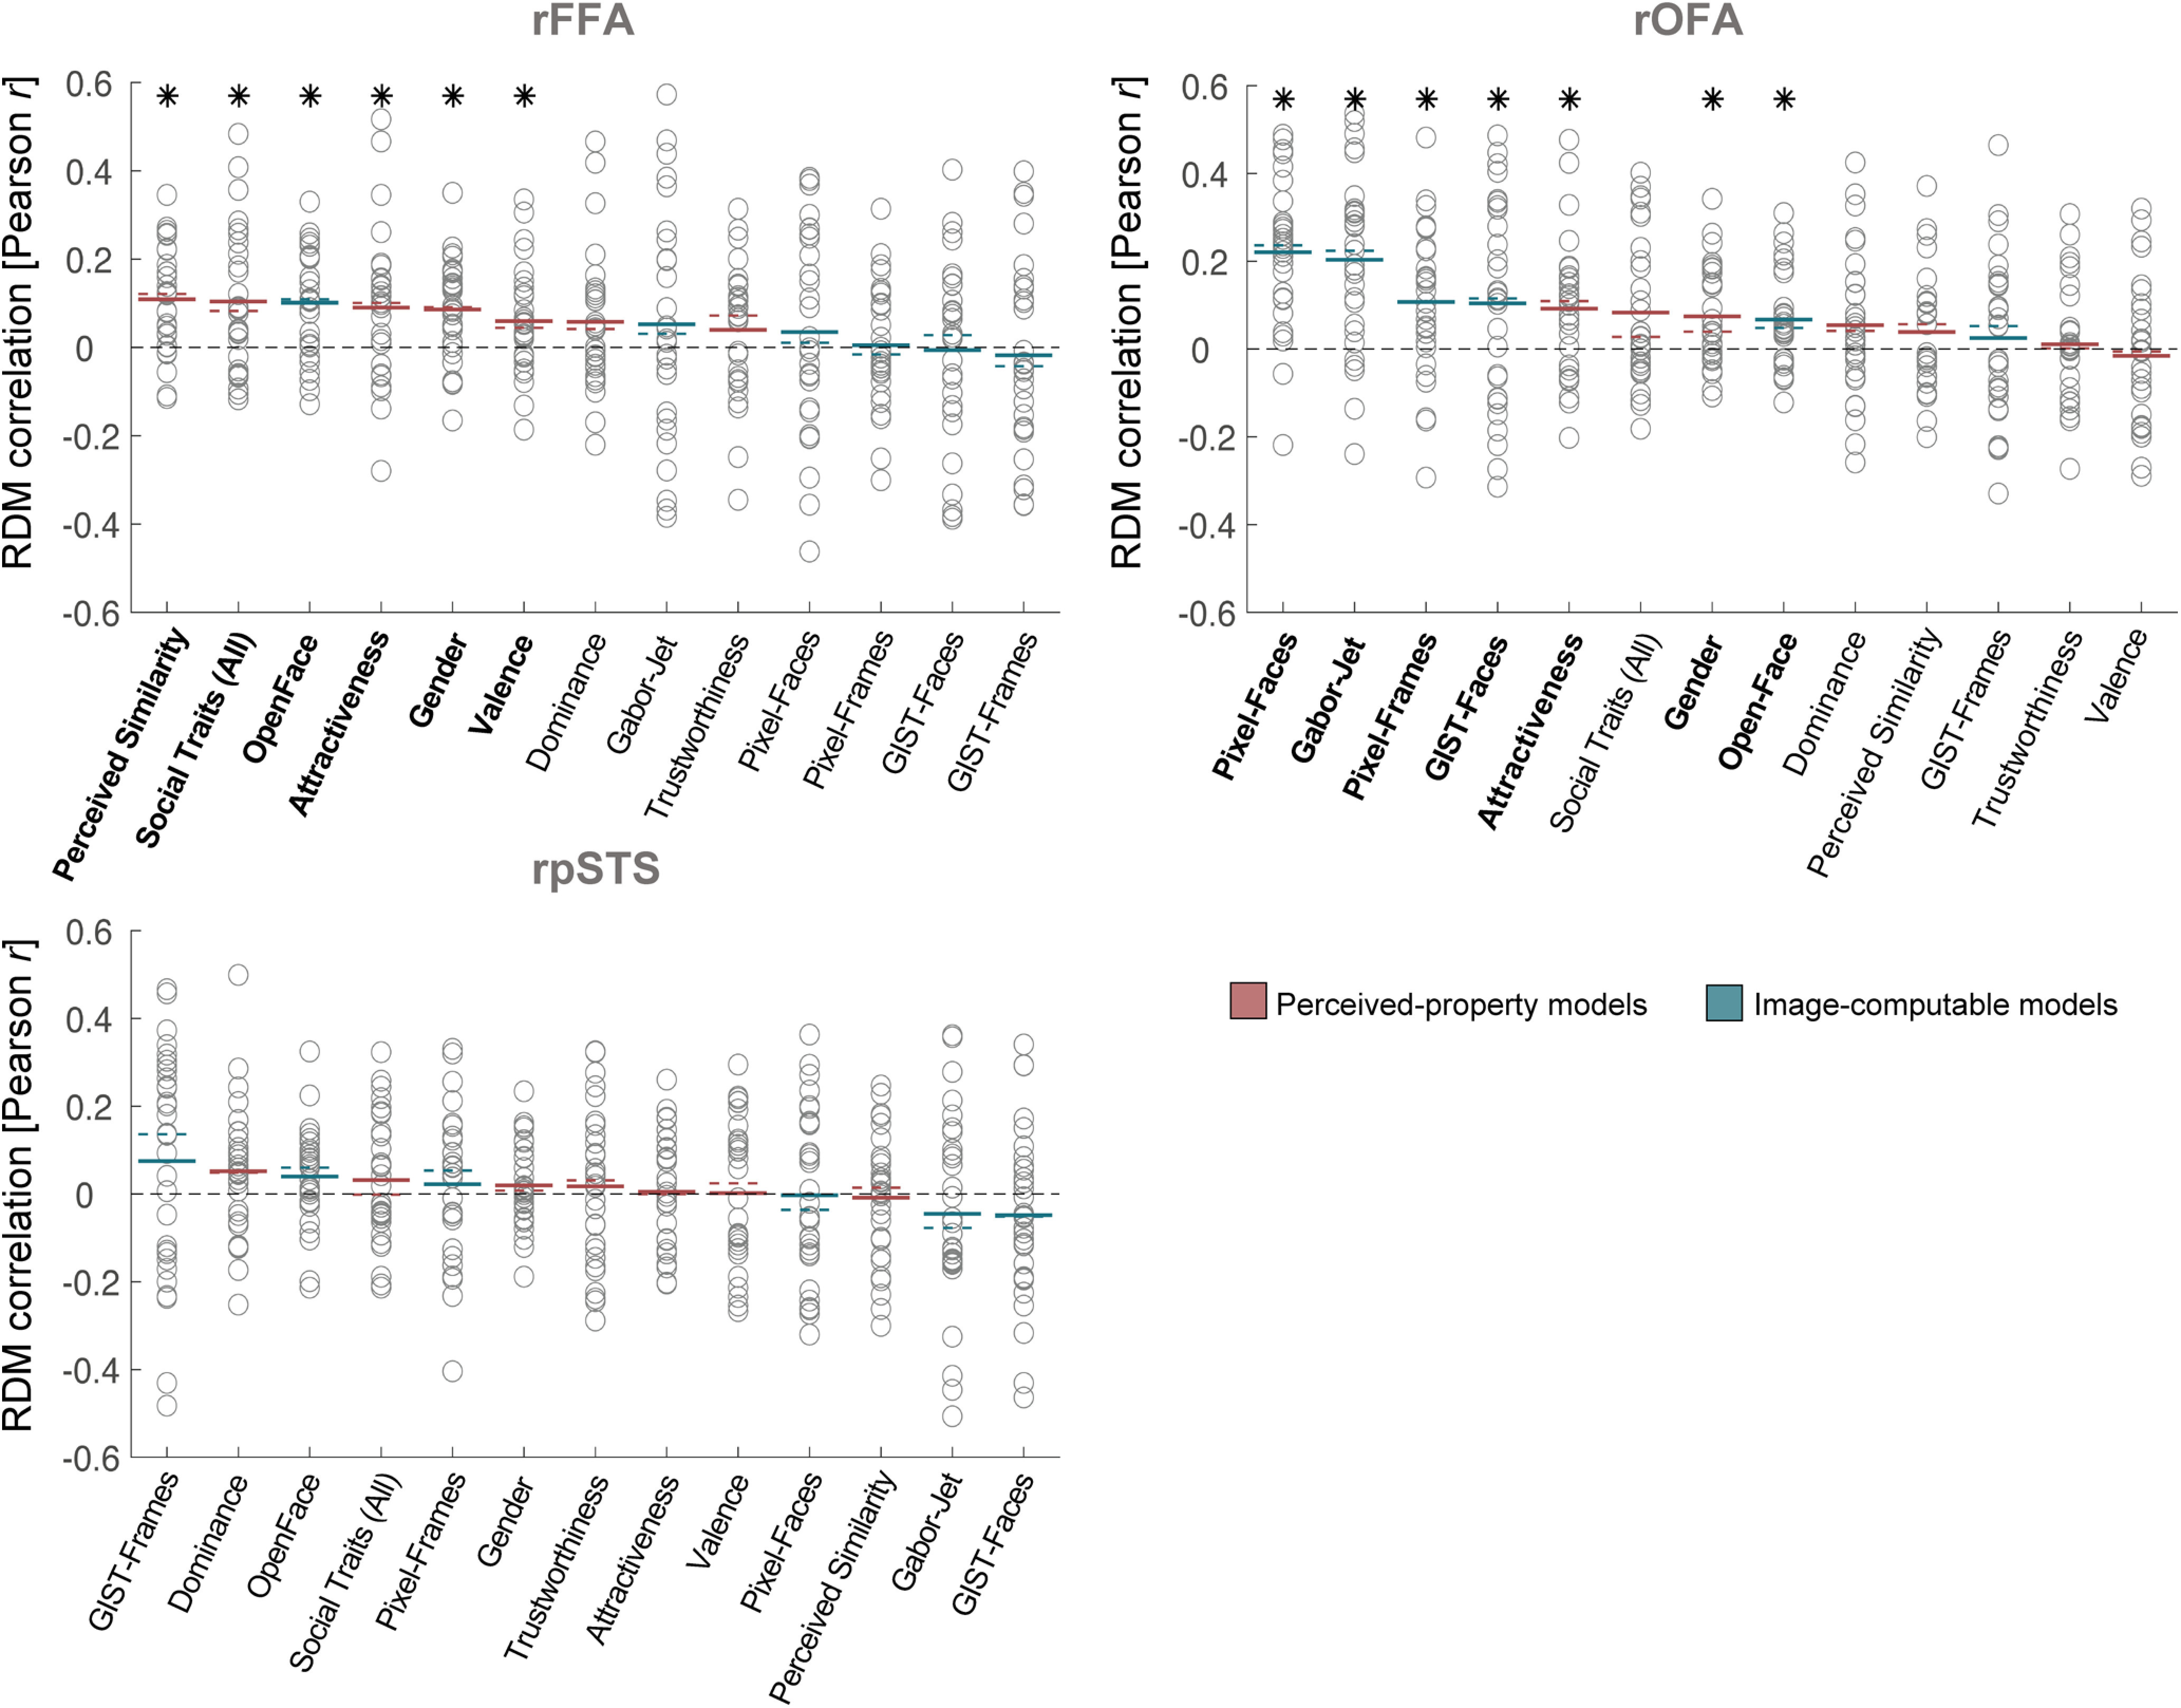
Figure 4.

Similarity between brain RDMs (in rFFA, rOFA, and rpSTS) and each of the candidate models, showing individual participant data. This figure shows the same data as in Figure 3A, but with added individual data. Circles represent correlations for individual participants. Colored lines indicate mean (full lines) and median (dotted lines) correlations across participants. Pink represents correlations with models based on Perceived-property models. Blue represents correlations with Image-computable models. Horizontal black dashed lines indicate the 0 correlation point. An asterisk above a bar and the name of the model in bold indicate correlations that were significantly >0. Correlations with individual models are sorted from highest to lowest based on the mean correlation across participants to match the format of Figure 3A.
