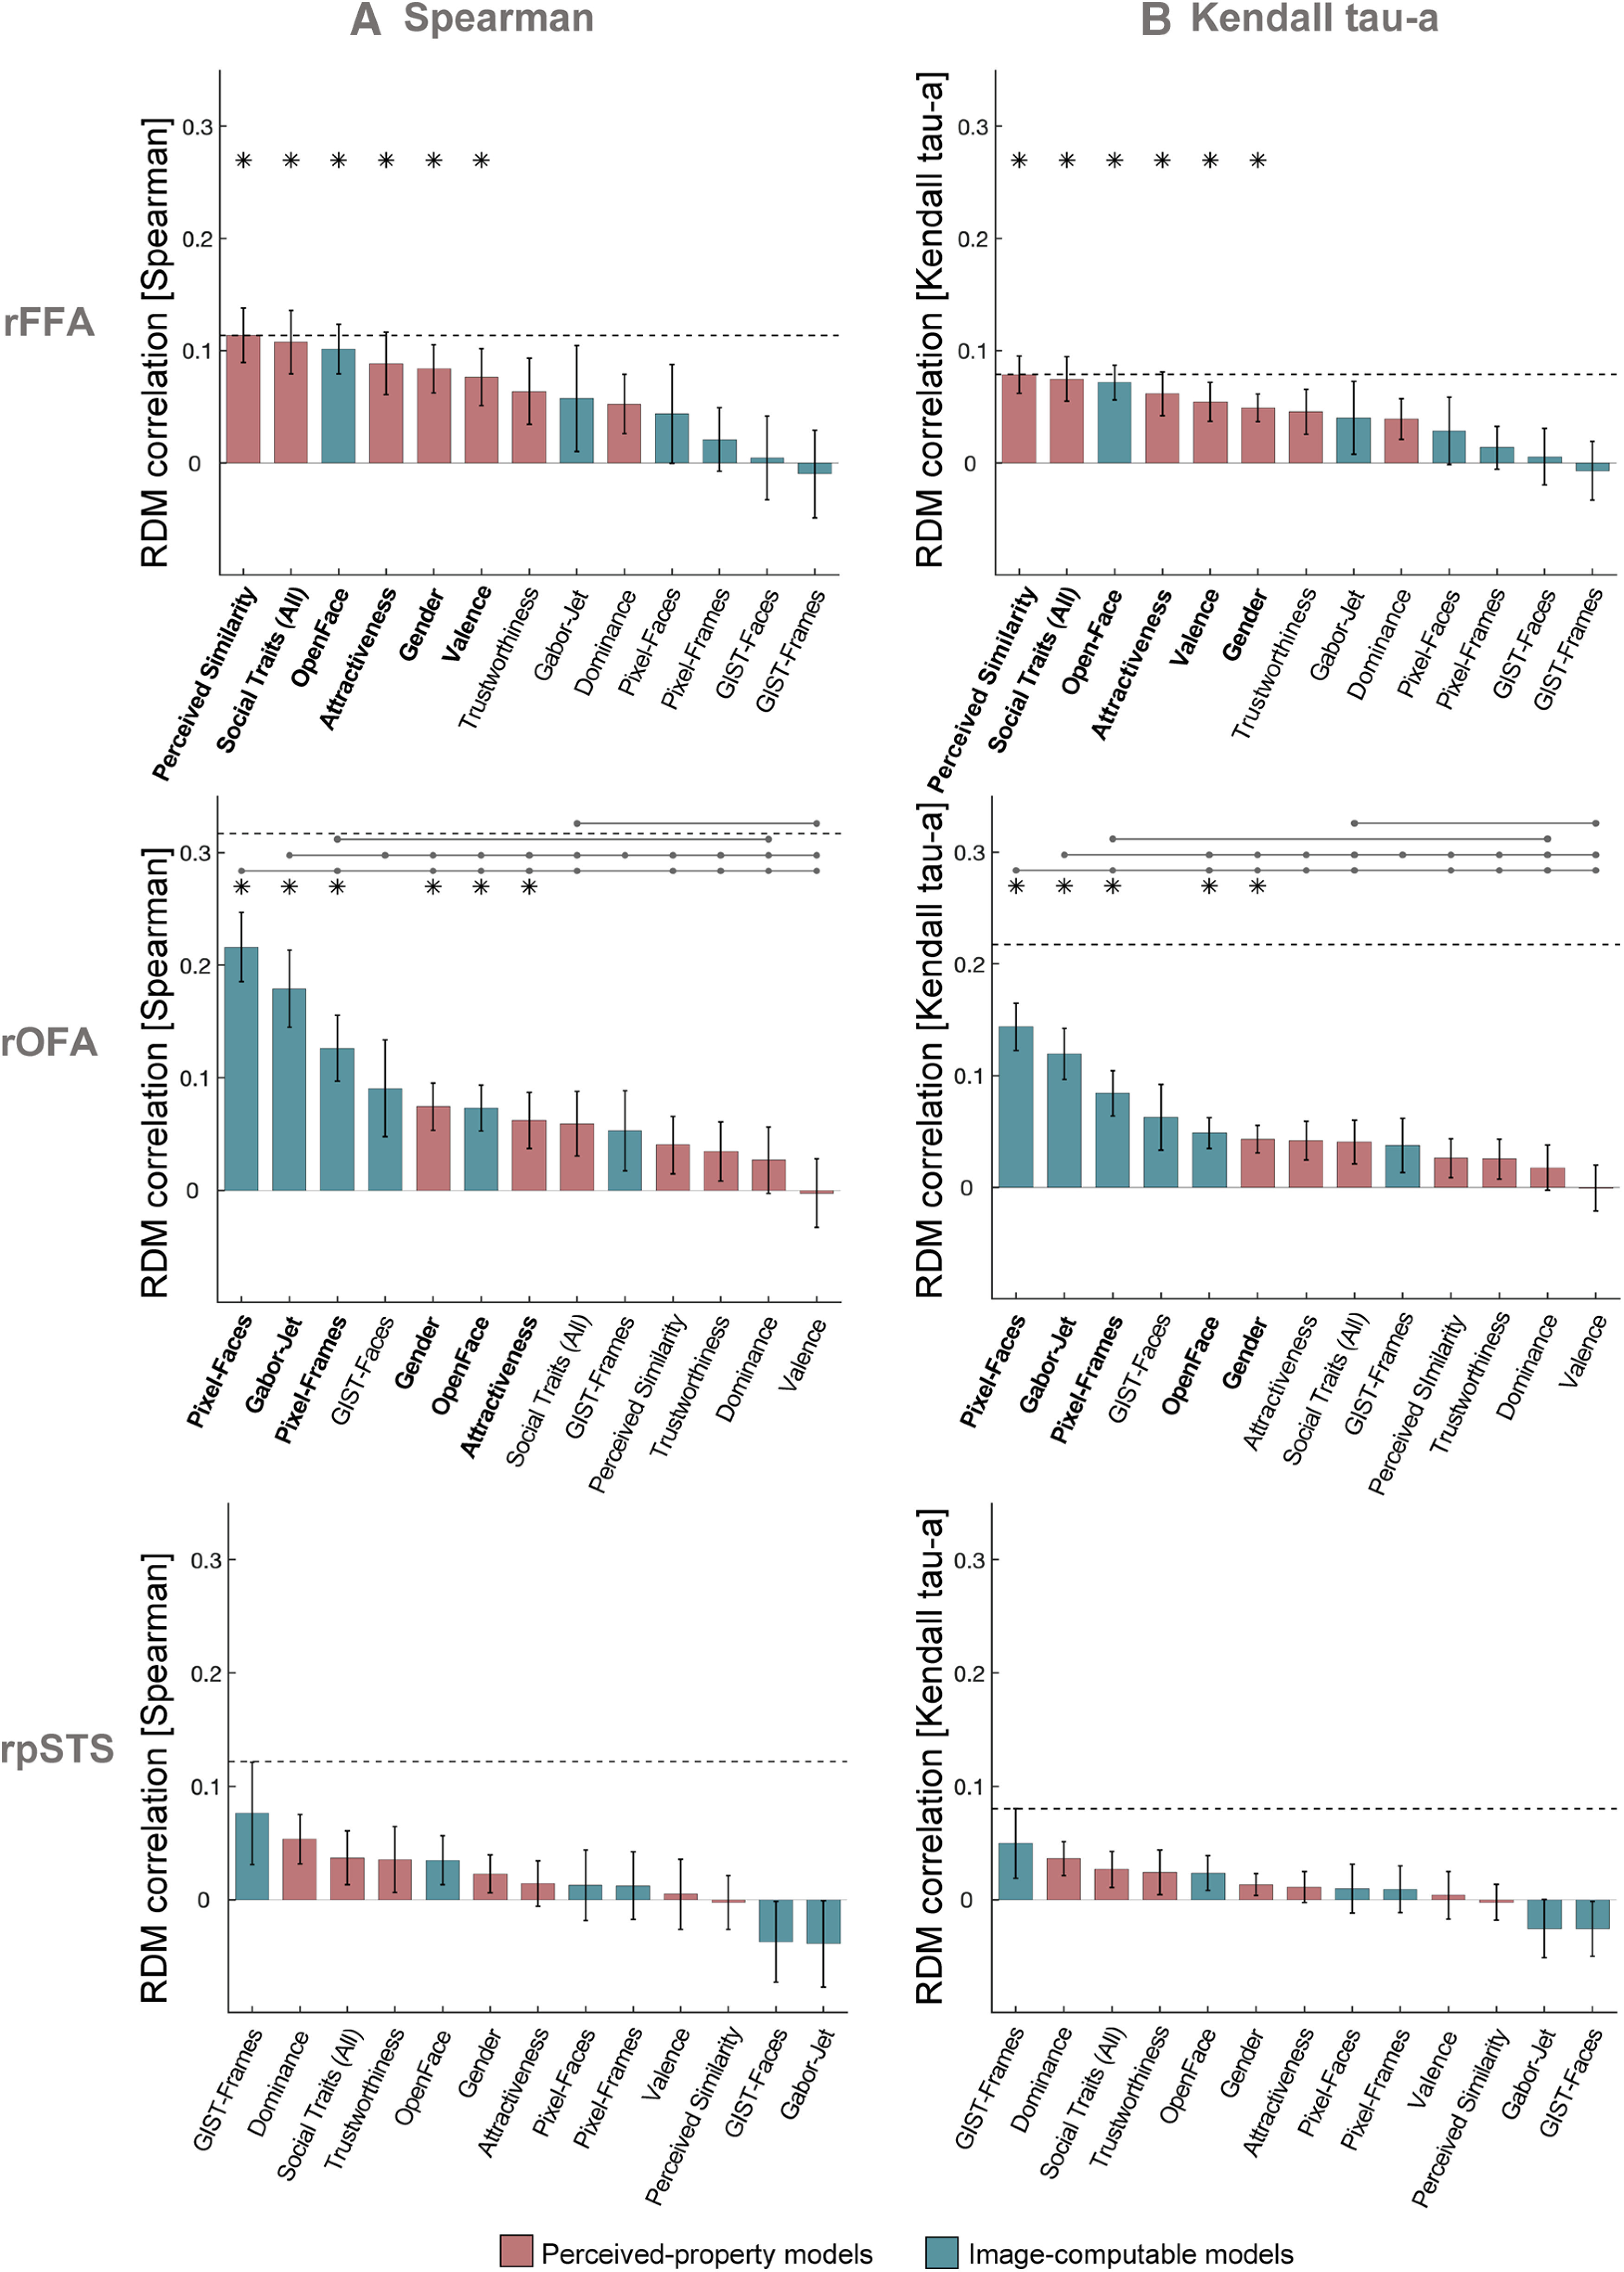
Figure 6.

Control analyses using other similarity measures between RDMs. Similarity between brain RDMs (in rFFA, rOFA, and rpSTS) and each of the candidate models using Spearman correlation (A) and Kendall tau-a (B). These analyses were identical to the analysis using Pearson correlations (Fig. 3A), with the exception that noise ceiling was computed after rank-transforming the RDMs (Nili et al., 2014). The pattern of results was similar across all three correlation measures. Bars show mean correlations across participants and error bars show standard error. Horizontal dashed lines show the lower bound of the noise ceiling. An asterisk above a bar and the name of the model in bold indicate that correlations with that model were significantly higher than zero. Horizontal lines above bars show significant differences between the correlations of the first marked column with the subsequent marked columns (FDR corrected for multiple comparisons).
