. 2021 Mar 8;129(3):037002. doi: 10.1289/EHP7102

Figure 2.

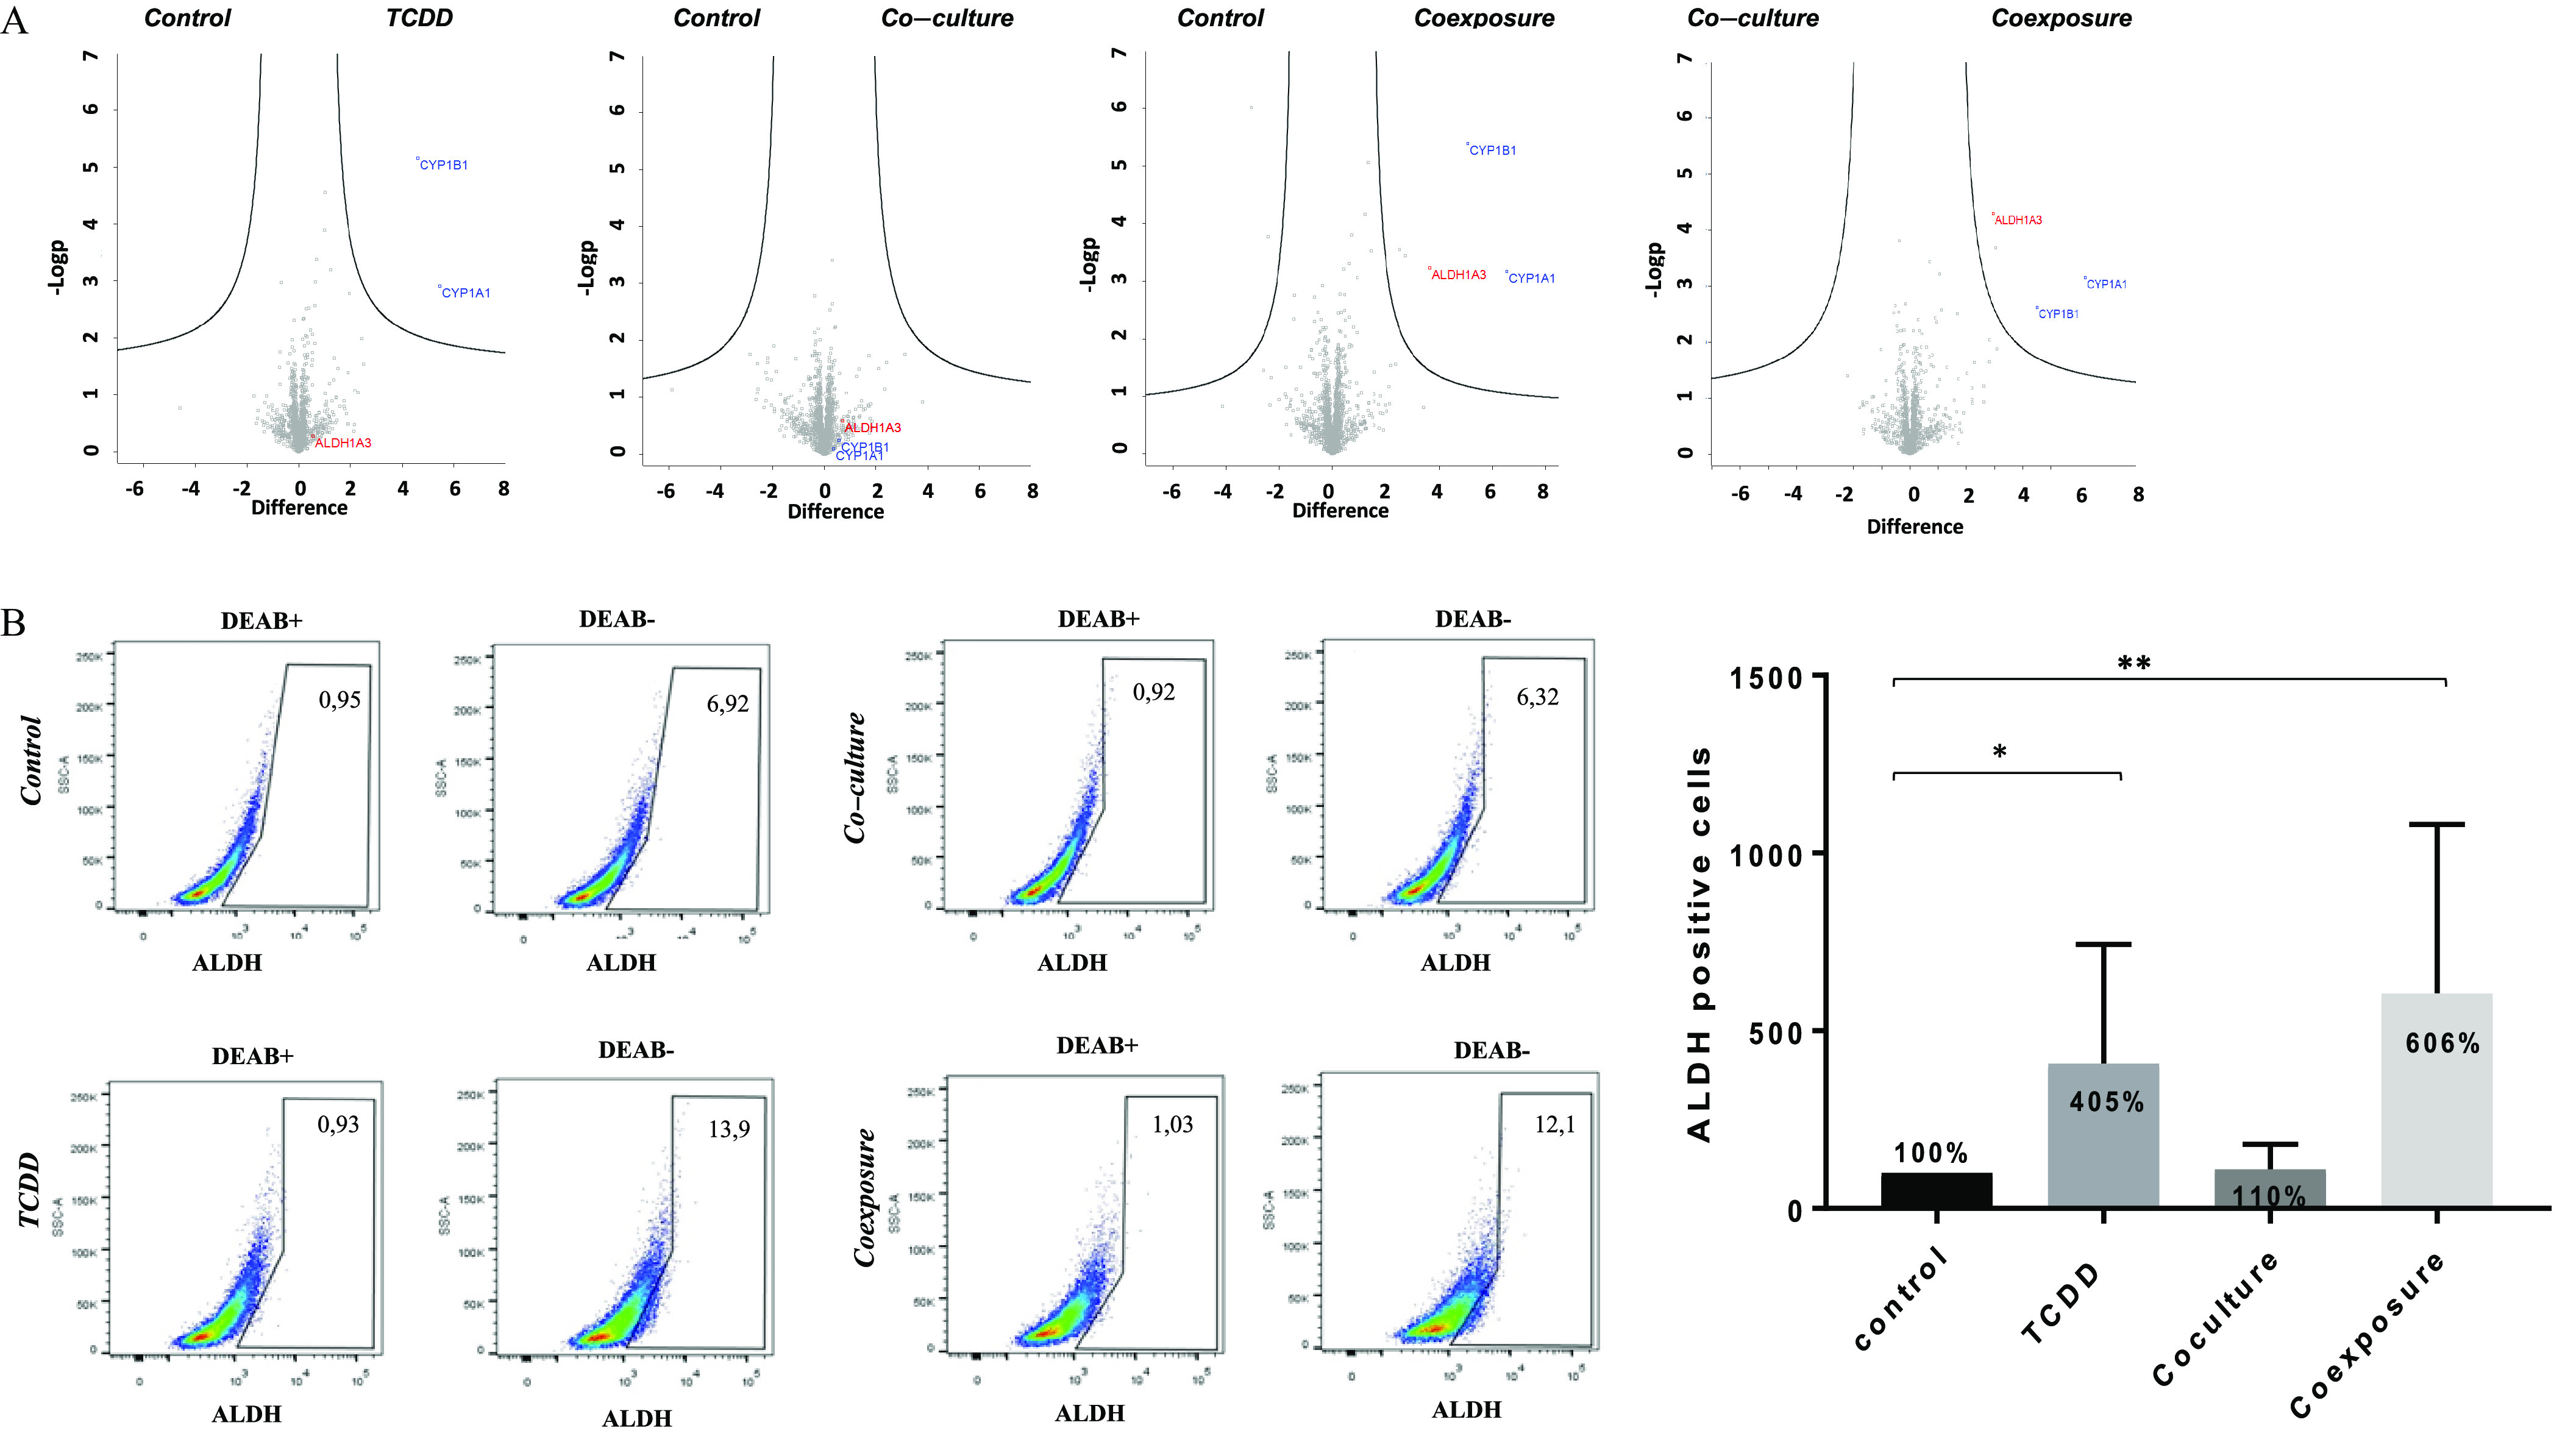
Figure 2A is a set of four volcano plots titled control and 2,3,7,8-Tetrachlorodibenzo-italic p-dioxin, control and co-culture, control coexposure, and co-culture and coexposure plotting negative log lowercase p, ranging from 0 to 7 in unit increments (y-axis) across difference, ranging from negative 6 to 8 in unit increments (x-axis) for Aldehyde dehydrogenase 1 family, member A3, Cytochrome P450 Family 1 Subfamily A Member 1, and Cytochrome P450 Family 1 Subfamily B Member 1. Figure 2B is a set of eight Flow cytometric dot plots and a bar graph. The first four Flow cytometric dot plots are titled uppercase n, n-diethylaminobenzaldehyde positive, uppercase n, n-diethylaminobenzaldehyde negative, uppercase n, n-diethylaminobenzaldehyde positive, and uppercase n, n-diethylaminobenzaldehyde negative plotting control uppercase s c-a, ranging from 0 to 250 thousand in increments of 50 thousand (y-axis) across Aldehyde dehydrogenase, ranging as 0, 10 begin superscript 3 end superscript, 10 begin superscript 4 end superscript, 10 begin superscript 4 end superscript, and 10 begin superscript 5 end superscript (x-axis). The second four Flow cytometric dot plots are titled uppercase n, n-diethylaminobenzaldehyde positive, uppercase n, n-diethylaminobenzaldehyde negative, uppercase n, n-diethylaminobenzaldehyde positive, and uppercase n, n-diethylaminobenzaldehyde negative plotting 2,3,7,8-Tetrachlorodibenzo-italic p-dioxin uppercase s c-a, ranging from 0 to 250 thousand in increments of 50 thousand (y-axis) across Aldehyde dehydrogenase, ranging as 0, 10 begin superscript 3 end superscript, 10 begin superscript 4 end superscript, 10 begin superscript 4 end superscript, and 10 begin superscript 5 end superscript (x-axis). The bar graph plots Aldehyde dehydrogenase positive cells, ranging from 0 to 1500 in increments of 500 (y-axis) across control, 2,3,7,8-Tetrachlorodibenzo-italic p-dioxin, Co-culture, and Coexposure (x-axis).

Proteomics analysis and ALDH enzymatic analysis of MCF7 cells growth in co-culture with hMADS and exposed to 25 nM TCDD for 48 h. (A) High-throughput proteomic analysis of MCF7 cells [Control (vehicle MCF-7 cells, alone), TCDD (MCF-7 cells treated with 25 nM TCDD), co-culture (MCF-7 co-cultured with hMADS), and coexposure (co-culture with TCDD)]. The plots show the mean of biological quadruplicates and technical triplicates for each sample. CYP1A1, CYP1B1, and ALDH1A3 were induced when they appeared in the upper right part of the representation. (B) ALDH (aldehyde dehydrogenase) enzymatic activity was detected in MCF7 cells using the ALDEFLUOR assay (FACS analysis). DEAB was used to inhibit the reaction of ALDH with the ALDEFLUOR reagent, providing a negative control. Percentage of ALDH positive cell was set according to the gate of DEAB control cells. Graph represents means of the percentage of ALDH positive cells (in bold) compared with the control±SEM of six measurements. The numerical information mean±SEM and p-values are provided in Table S2. (Kruskal–Wallis’s H test (nonparametric comparison of k independent series) followed by a 1-factor ANOVA test (parametric comparison of k independent series, **p<0.01; *p<0.05). Note: ANOVA, analysis of variance; SEM, standard error of the mean; TCDD, 2,3,7,8-tetrachlorodibenzo-p-dioxin.