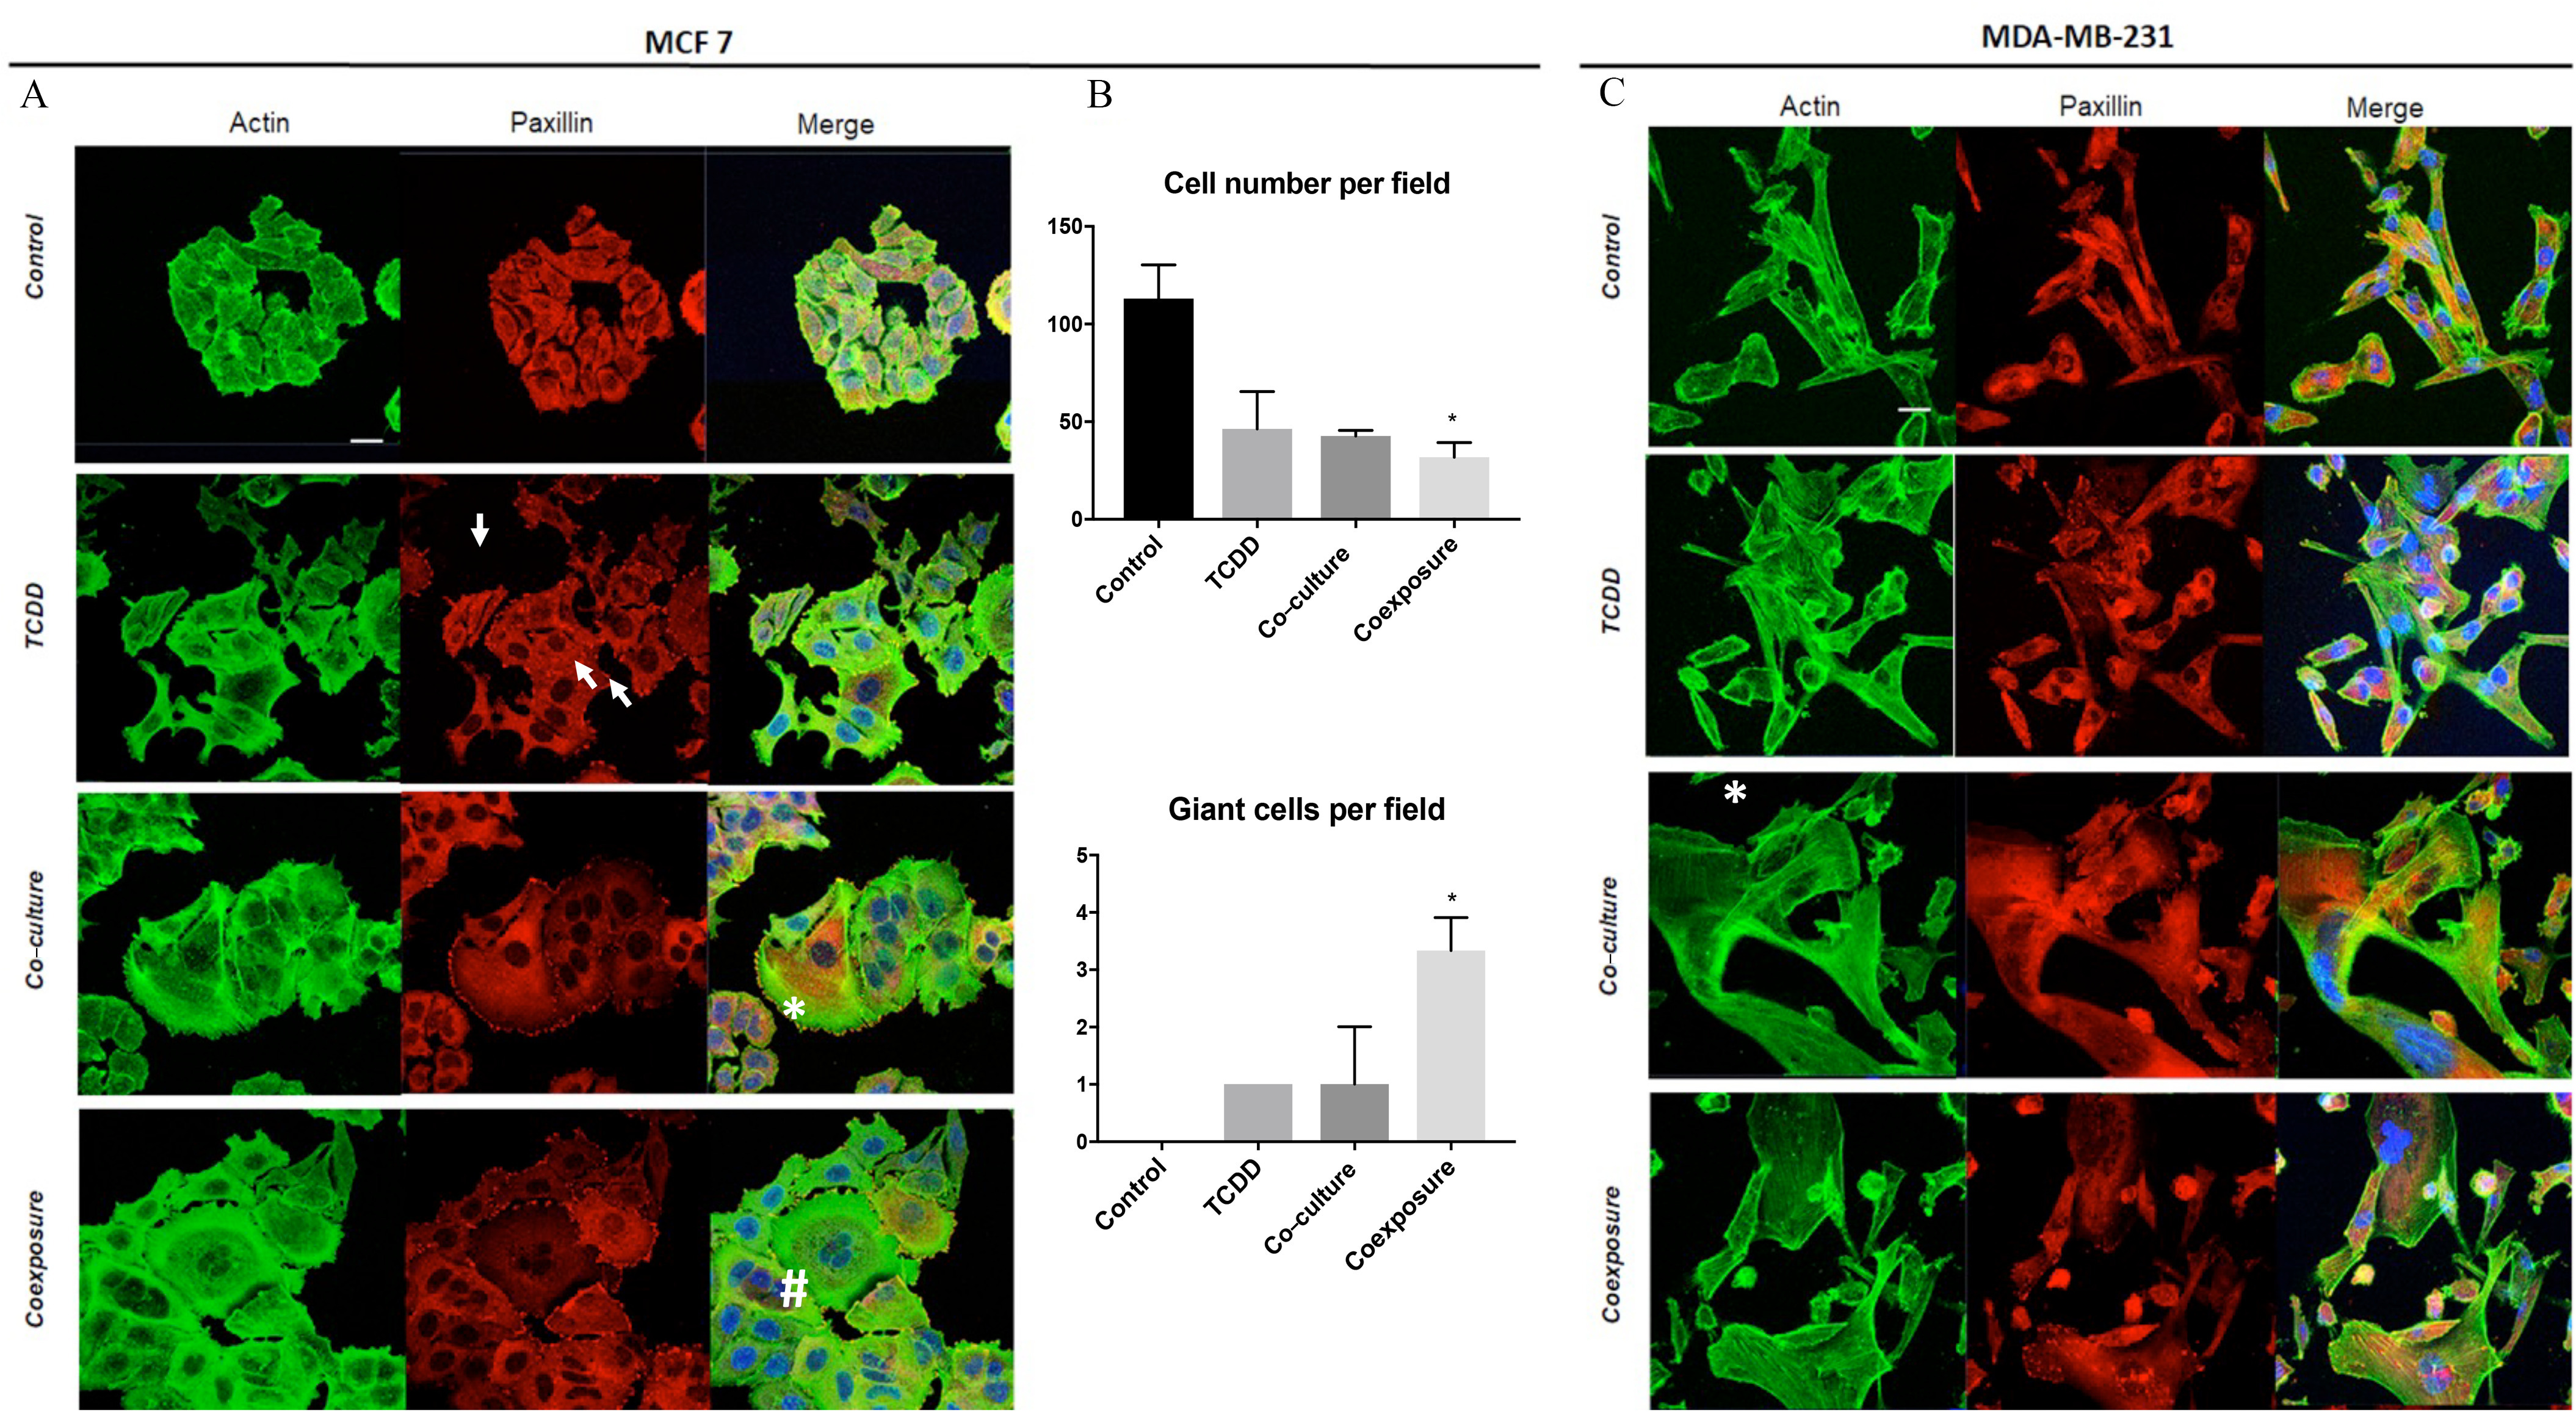
Figure 4.

Morphological differences of MCF7 cells and MDA-MB-231 cells following exposure to TCDD, co-culture, or coexposure. Cells were grown with hMADS and/or treated with TCDD [Control (vehicle MCF-7 cells, alone), TCDD (MCF-7 cells treated with TCDD), co-culture (MCF-7 co-cultured with hMADS), and coexposure (co-culture with TCDD)]. After 48 h treatment, cells were fixed and stained for paxillin, actin, and nucleus (blue). (A) Staining of MCF7 cells. Scale bar . (B) Quantitation of MCF7 cell number and giant cells (very large cells with multiple nuclei) per field () field per conditions. Graph represents of three experiments. The numerical information and p-values are provided in Table S4. Kruskal–Wallis’s H test (nonparametric comparison of k independent series) followed by a 1-factor ANOVA test (parametric comparison of k independent series, *). (C) Staining of MDA-MB-231. Scale bar . Symbols were used to point out the focal adhesions (arrow), lamellipods (*) and giant cells (#). Note: ANOVA, analysis of variance; SEM, standard error of the mean; TCDD, 2,3,7,8-tetrachlorodibenzo-p-dioxin.
