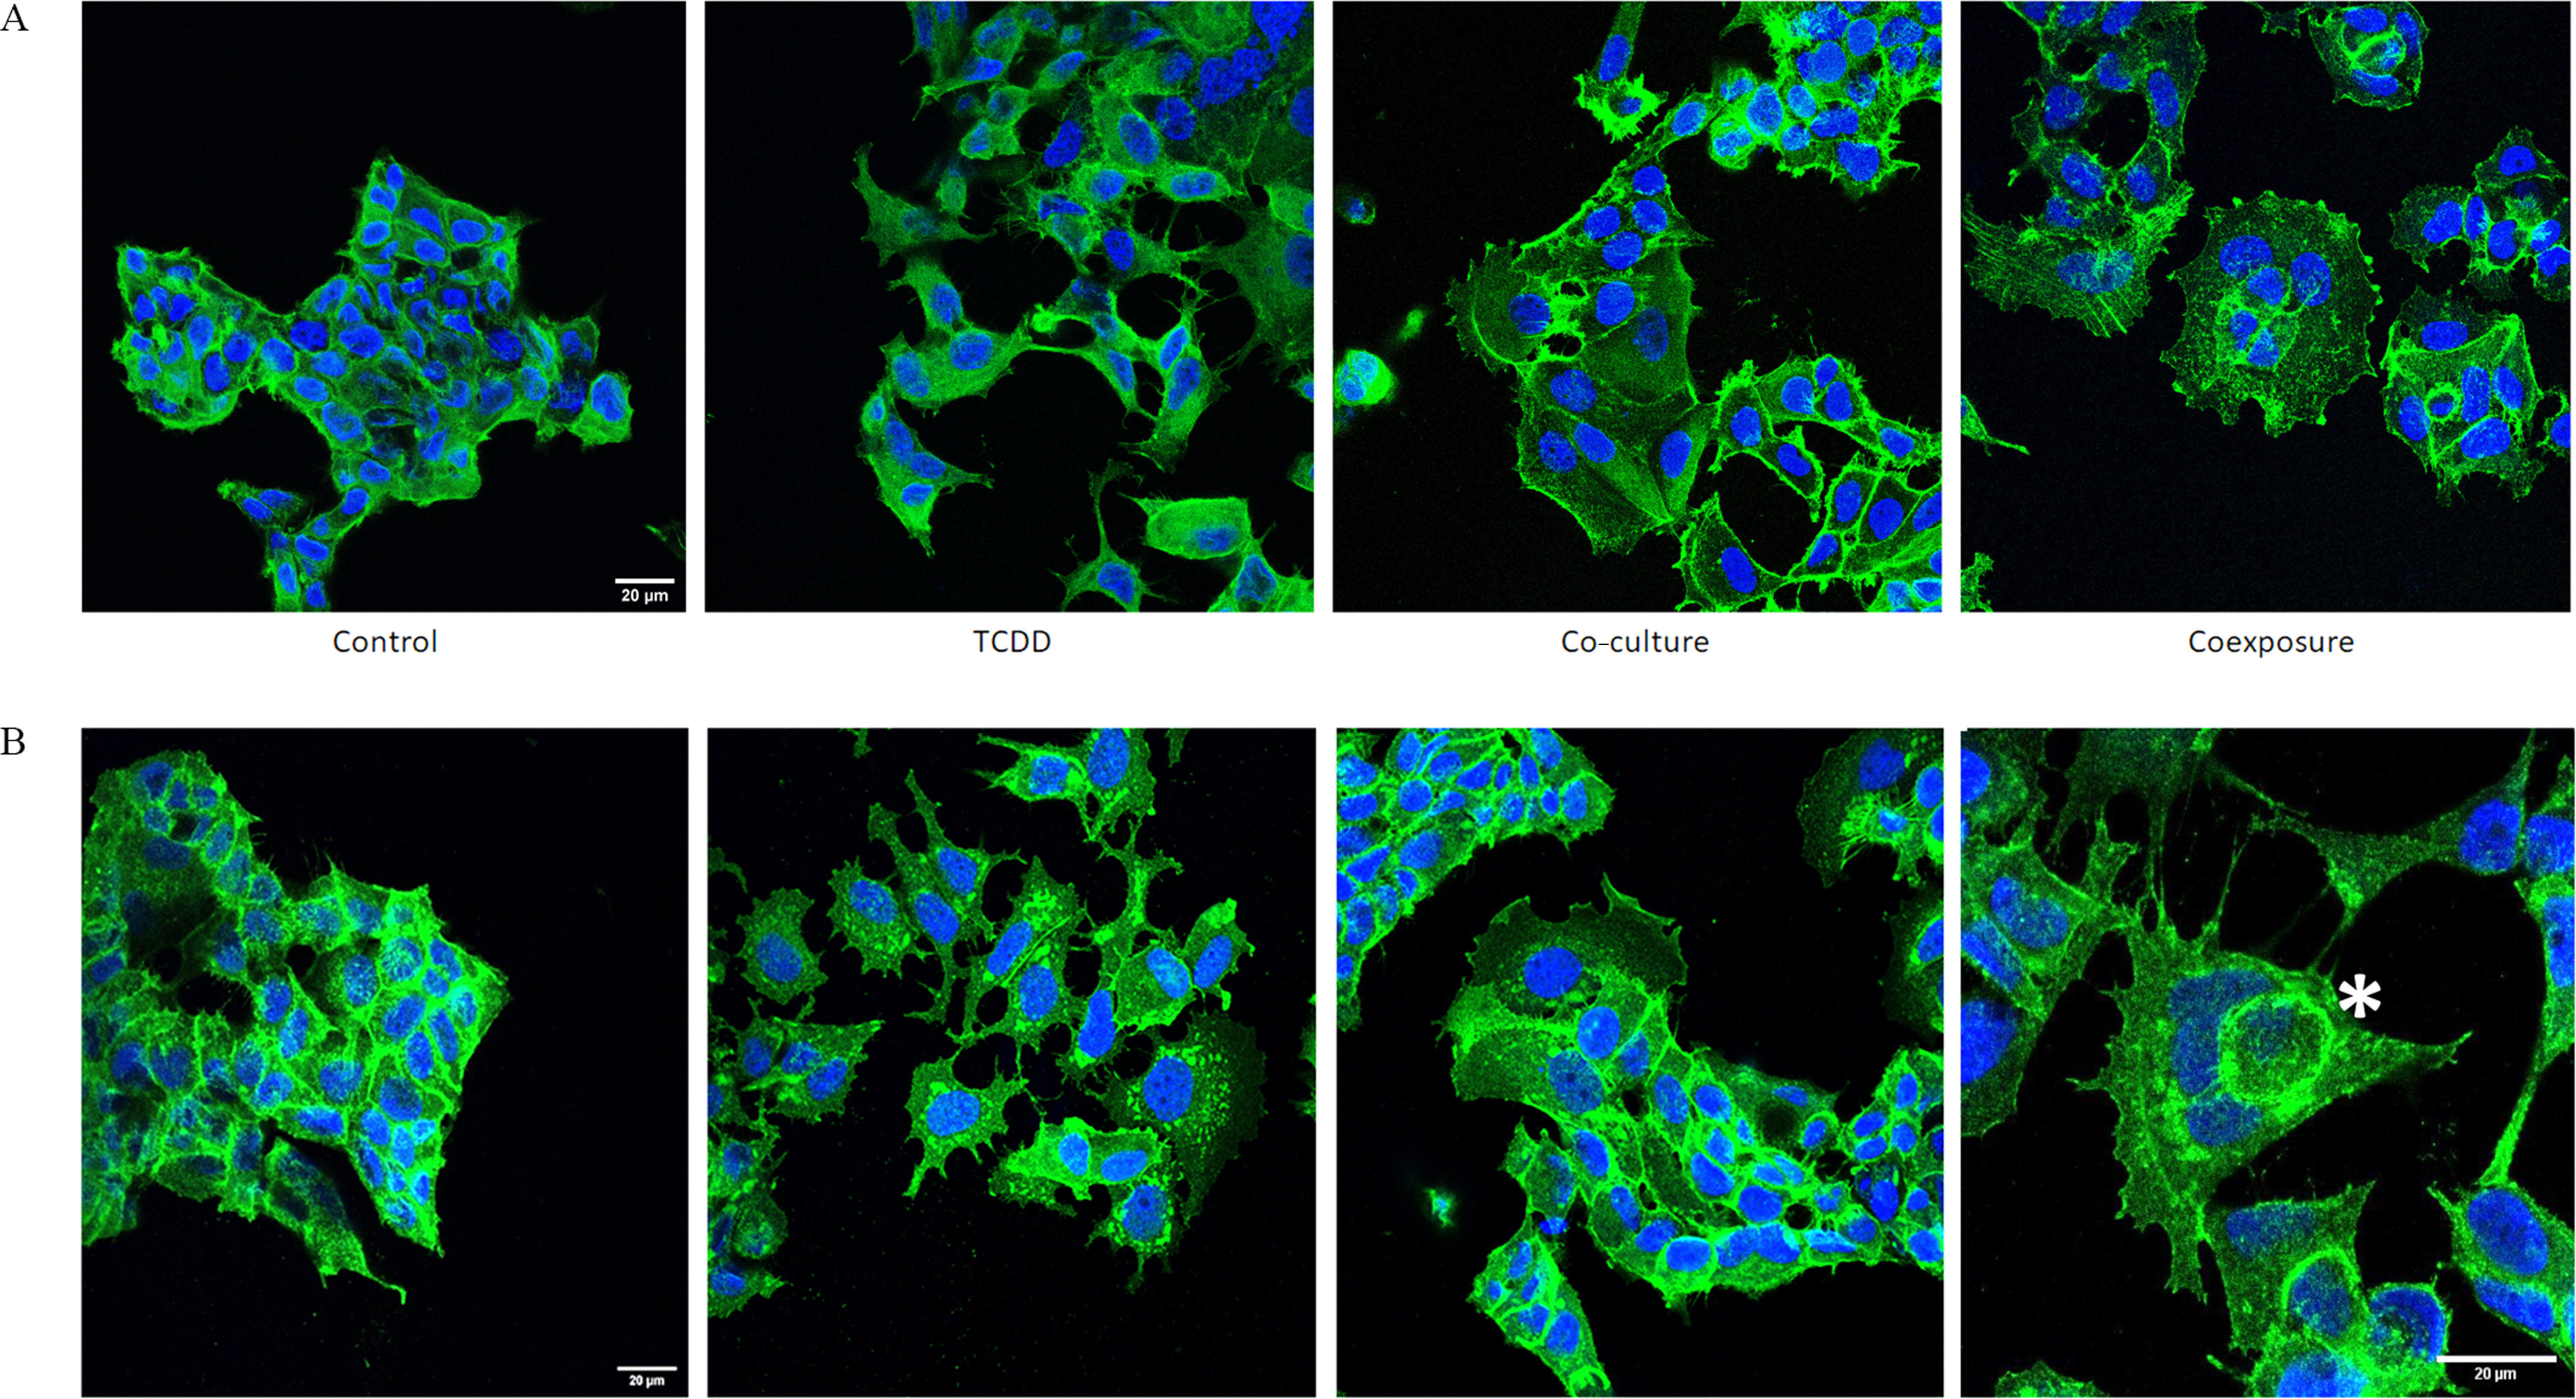
Figure 5.

Protein (A-actin, B-beta-catenin) localization & nucleus staining in MCF7 cells and MDA-MB-231 cells. MCF7 cells were grown with hMADS and/or treated with TCDD for 48h [Control (vehicle MCF-7 cells, alone), TCDD (MCF-7 cells treated with TCDD), co-culture (MCF-7 co-cultured with hMADS), and coexposure (co-culture with TCDD)]. (A) MCF7 cells were stained for actin (green) and nucleus (blue). Scale bar . (B) MCF7 cells were stained for beta-catenin (green) and nucleus (blue). One representative cell with cell-in-cell structures was marked with an asterisk (*). Scale bar . Note: TCDD, 2,3,7,8-tetrachlorodibenzo-p-dioxin.
