
Figure 2.
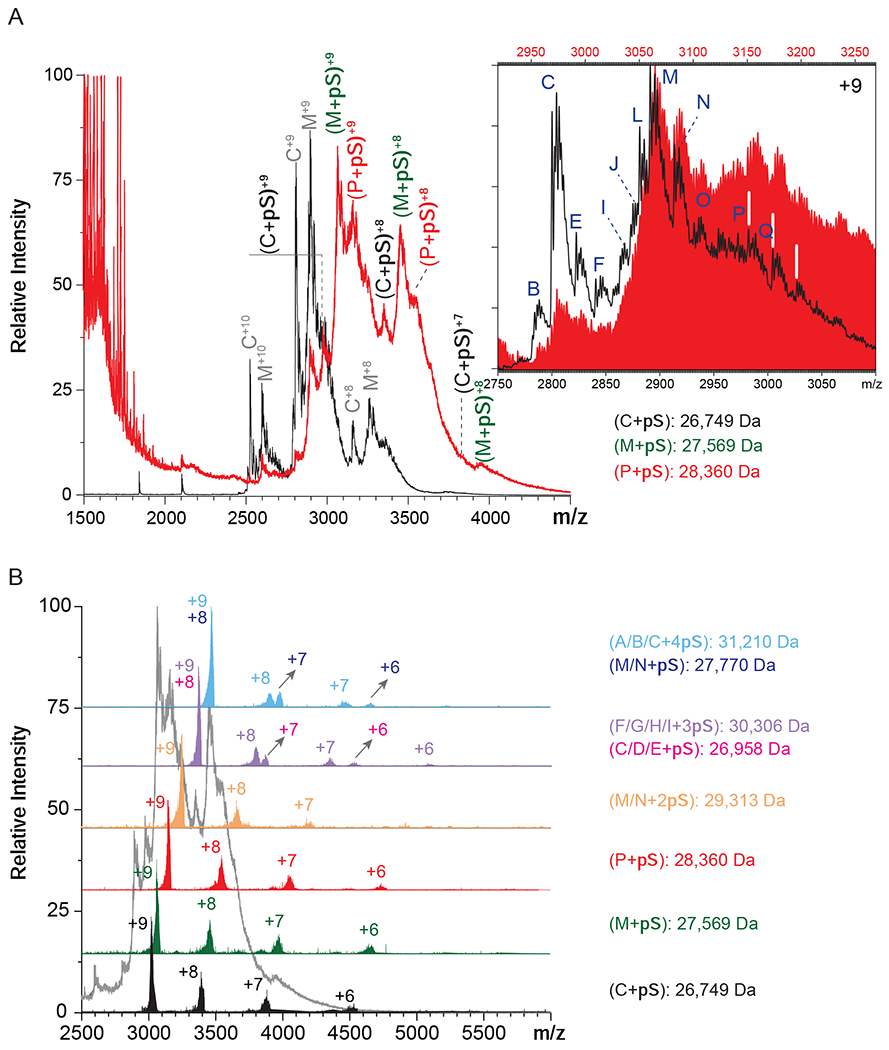
Native MS of a solution containing 25 μM synthetic pentasaccharide fondaparinux (pS) and 5 μM hNE (molar ratio pS:hNE=5:1) (A). The mass spectrum of hNE (black) is used as a reference. The inset shows the overlaid mass spectra of hNE (black) and hNE/pS (red, made by shifting the m/z scale by the value of the mass of pS (1,550 Da)). Charge ladders are generated using limited charge reduction to identify 1:1 and 1:n hNE/pS complexes (B).