
Figure 5.
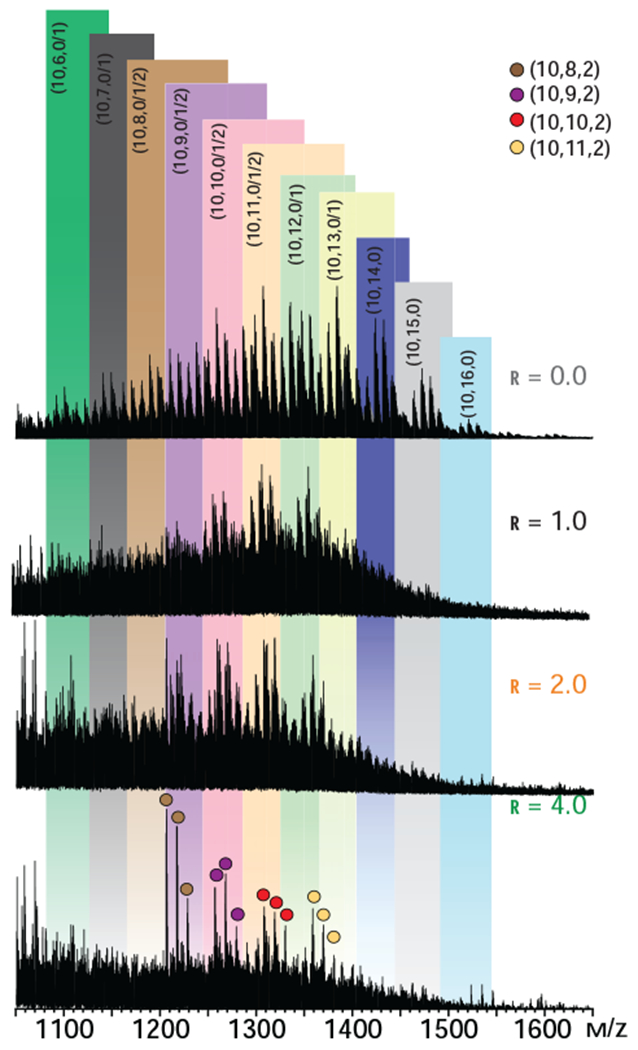
Distributions of unbound dp10 molecules in a 5 μM solution of hNE incubated with dp10 at different molar ratios (as indicated on each graph, r represents the molar ratio of protein to dp10). The bottom trace represents a reference spectrum of dp10 in a protein-free solution. Only ions at +2 charge state are shown for clarity. Ions representing individual heparin oligomers are labeled according to Henriksen’s nomenclature,47 where the three numbers in parentheses represent the oligosaccharide length, the total number of sulfate groups, and the total number of acetyl groups.