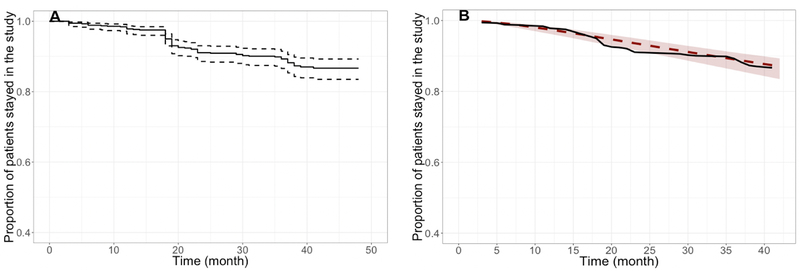
Figure 2. Kaplan Meier plots showing observed proportion of subjects remained in the study (A) and comparison between observed and simulated dropout rates with the final model (B).
Note: The pink line corresponds to Kaplan-Meier (nonparametric) estimates based on the observed data; the black line with shading corresponds to model predictions with the 95% CI.

