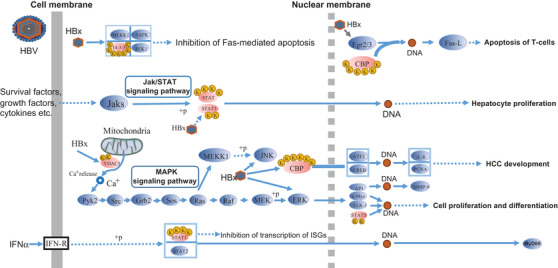
FIGURE 9.

The diagram of proteins with upregulated acetylation between HCC and paracancerous tissues in hepatitis B virus pathway (extracted from KEGG database, hsa05161). The yellow circle with K (lysine) represents acetylated lysine residues. The ellipse with light red and light blue color refers to Kac proteins with upregulated acetylation level and proteins without lysine acetylation in hepatitis B virus pathway, respectively. The solid and dotted gray vertical lines indicate the cell membrane and nuclear membrane, respectively
