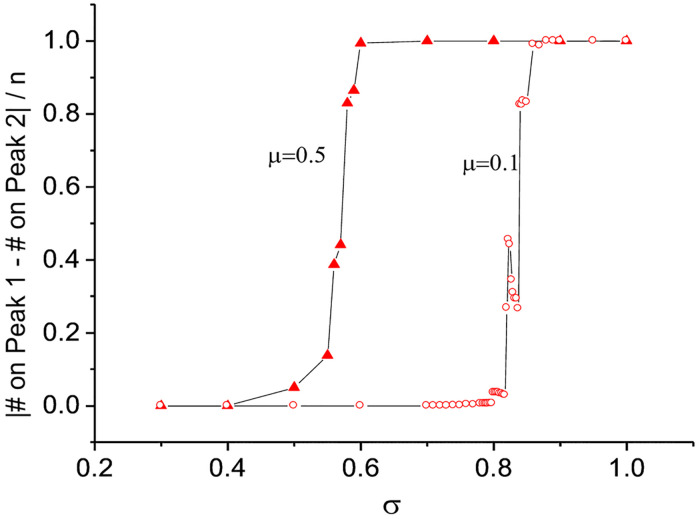
Fig 5. Transition to one-peak convergence.
On the vertical axis, we report the absolute value of the difference between the number of individuals on one peak and the number of individuals on the other, divided by the entire number of individuals. If this ratio is 0, it means that the number of individuals on each peak is the same. For example, if 50 out of 100 individuals are on one peak and the other 50 are on the other peak, the value is |50–50|/100 = 0. As the ratio approaches 1, this means that there are more individuals on one peak than on the other. When the value is equal to 1 (i.e., |0–100|/100 = 1), all individuals are located only on one peak.

